Quantcast
Viewing all 261 articles
Browse latest View live

Tip : Text only background color in jasper reports with style tag

Hi,

To get the text only background with given color in jasper text elements, write below code.

"<style backcolor=\"yellow\">Hello .! My background color is yellow </style>"

Importantly , give MarkUp=Styled in the TextField properties

Click on image to get better view: 


Sample output:


Example JRXML:  (Studio 6.4 professional version)

<?xml version="1.0" encoding="UTF-8"?>
<!-- Created with Jaspersoft Studio version 6.4.0.final using JasperReports Library version 6.4.1  -->
<jasperReport xmlns="http://jasperreports.sourceforge.net/jasperreports" xmlns:xsi="http://www.w3.org/2001/XMLSchema-instance" xsi:schemaLocation="http://jasperreports.sourceforge.net/jasperreports http://jasperreports.sourceforge.net/xsd/jasperreport.xsd" name="Blank_A4_1" pageWidth="595" pageHeight="842" whenNoDataType="AllSectionsNoDetail" columnWidth="555" leftMargin="20" rightMargin="20" topMargin="20" bottomMargin="20" uuid="01d3505b-1aa3-468b-ae16-491d8c5ceb57">
<property name="com.jaspersoft.studio.data.defaultdataadapter" value="One Empty Record"/>
<queryString>
<![CDATA[]]>
</queryString>
<background>
<band splitType="Stretch"/>
</background>
<title>
<band height="79" splitType="Stretch">
<textField>
<reportElement x="0" y="0" width="555" height="79" uuid="1a620294-fdcf-42f3-8fc3-66548fc72941"/>
<box>
<topPen lineWidth="1.0" lineStyle="Solid" lineColor="#000000"/>
<leftPen lineWidth="1.0" lineStyle="Solid" lineColor="#000000"/>
<bottomPen lineWidth="1.0" lineStyle="Solid" lineColor="#000000"/>
<rightPen lineWidth="1.0" lineStyle="Solid" lineColor="#000000"/>
</box>
<textElement textAlignment="Center" verticalAlignment="Middle" markup="styled">
<font size="14"/>
</textElement>
<textFieldExpression><![CDATA["<style backcolor=\"yellow\">Hello .! My background color is yellow </style>"]]></textFieldExpression>
</textField>
</band>
</title>
<pageHeader>
<band height="35" splitType="Stretch"/>
</pageHeader>
<columnHeader>
<band height="61" splitType="Stretch"/>
</columnHeader>
<detail>
<band height="125" splitType="Stretch"/>
</detail>
<columnFooter>
<band height="45" splitType="Stretch"/>
</columnFooter>
<pageFooter>
<band height="54" splitType="Stretch"/>
</pageFooter>
<summary>
<band height="42" splitType="Stretch"/>
</summary>

</jasperReport>

Reference: 
https://community.jaspersoft.com/questions/514115/setting-textelement-background-color-style-tag

Tip: group count variable calculation in jasper reports

Hi,

Group count calculation can be done as follows in jasper reports.

Scenario : 
Report Design:
<GroupNumber>  <GroupBand>
                             <detailband>

Example: 
   IamGroupValue1
         row1_value
         row2_value
         row3_value
2    IamGroupValue2
       row1_value
       row2_value
  IamGroupValue2
      row1_value
      row2_value
      row3_value
      row4_value
...
...
...

Steps:
1) Create your group (lets say Group1 , give the field value by which you want to group by)
2) Observe variables - there it creates a variable called "Group1_Count"
3) Create a new variable of Integer type , let say : groupCount
4) Give below expression for the groupCount variable
      $V{Group1_COUNT} == 1 ? ($V{groupCount} + 1) : $V{groupCount}
5) Put Increment Type= [Group]Group1 and Reset Type =Report and Initial Value=1
6) Pull this variable onto the group header where you want to get it.
7) Run the report observe the group count in output.

Calculation Image: 

Reference : 
https://stackoverflow.com/questions/17480184/how-to-show-the-number-of-group


Tip : Disable yAxis values for column or bar of highcharts in jasper reports

Hi,

Problem Statement : 
How to remove yAxis values from  a highcharts column or bar graph ?
Solution: 
1) Navigate to the Advanced properties of the column graph.
2) From the list of folders in the advanced properties choose "yAxis" and expand it.
3) Scroll down till you find again a folder called "lables".
4) In the labels folder select "format" property (by default it would have default value as {value}) and double click or click on modify button.
5) Change the value of it from {value} to {}
6) Save your report and preview the the visualization


Output should look like as below


I hope this helps someone. 

- Sadakar Pochampalli

Tip : How to remove interactivity features for highcharts in jasper reports

Hi

1) Select the chart component
2) Go to advanced properties
3) In the Misc section click on Edit properties option to add below property.
com.jaspersoft.jasperreports.highcharts.interactive= false 
4) Save your report and preview the output in server or interactive mode in studio.

Sample output: 
Thank you for stopping by.!

- Sadakar Pochampalli 

Spark Line widget visualization example in Jaspersoft reports

Hi folks, 

In this post, you would see how to work with SparkLine widget in Jaspersoft reports. I'd be explaining core points as steps in this article. 

The aim of the post is to develop a report which would have below look and feel with sparkline widget.


1) Write below query in Query editor of the JRXML

Sample query:
(SELECT 'text' AS text1, 'text' AS text2, 10 AS value1, 20 AS value2, 30 AS value3, 40 AS value4,  1234 AS value FROM customer limit 1)
UNION ALL
(SELECT 'text' AS text1, 'text' AS text2, 34 AS value1, 54 AS value2, 12 AS value3, 78 AS value4,  1234 AS value FROM customer limit 1)
UNION ALL
(SELECT 'text' AS text1, 'text' AS text2, 43 AS value1, 76 AS value2, 21 AS value3, 40 AS value4,  1234 AS value FROM customer limit 1)
UNION ALL
(SELECT 'text' AS text1, 'text' AS text2, 40 AS value1, 20 AS value2, 12 AS value3, 43 AS value4, 1234 AS value FROM customer limit 1)
UNION ALL
(SELECT 'text' AS text1, 'text' AS text2, 65 AS value1, 21 AS value2, 87 AS value3, 45 AS value4,  1234 AS value FROM customer limit 1)

Sample output of the above query:

2) Drag and drop SparkLine widget from the "Widget Pro" section of the Palette. 

3) Our goal to get the spark lines in details of the report, so the report design should look like below 
i.e., keep spark line widget graph in detail band

4) Edit widget properties to provide the values for lines plotting on visualization. Usually, in a normal line chart we take category and values to plot lines but in case of spark lines we take directly the numeric columns say  value1, value2, value3 and value4 from the sample query. 

IMP NOTE : Ensure that Reset Type = None in "Widget Data" section of "Dataset"

IMP NOTE: Take a look at the Basic and Advanced properties of Widget graph to get the exact look and feel as shown in this article in the top image. 

5) Save the report and publish it to jasperserver and you would be able to see the report output as shown in very first image of the post. 


JRXML : ( Supported in 6.4.2 Professional)

<?xml version="1.0" encoding="UTF-8"?>
<!-- Created with Jaspersoft Studio version 6.4.2.final using JasperReports Library version 6.4.1  -->
<jasperReport xmlns="http://jasperreports.sourceforge.net/jasperreports" xmlns:xsi="http://www.w3.org/2001/XMLSchema-instance" xsi:schemaLocation="http://jasperreports.sourceforge.net/jasperreports http://jasperreports.sourceforge.net/xsd/jasperreport.xsd" name="SparkLineWidgetDemo" pageWidth="595" pageHeight="842" columnWidth="555" leftMargin="20" rightMargin="20" topMargin="20" bottomMargin="20" uuid="a3ce0107-9a6a-4388-a083-a433148b1fc7">
<property name="com.jaspersoft.studio.data.defaultdataadapter" value="foodmartlatha"/>
<property name="com.jaspersoft.studio.data.sql.tables" value=""/>
<property name="ireport.jasperserver.url" value="http://localhost:8080/jasperserver-pro/"/>
<property name="ireport.jasperserver.user" value="superuser"/>
<property name="ireport.jasperserver.report.resource" value="/EarthlySystems/SparkLineWidgetDemo_files/main_jrxml"/>
<property name="ireport.jasperserver.reportUnit" value="/EarthlySystems/SparkLineWidgetDemo"/>
<queryString>
<![CDATA[(SELECT 'text' AS text1, 'text' AS text2, 10 AS value1, 20 AS value2, 30 AS value3, 40 AS value4,  1234 AS value FROM customer limit 1)
UNION ALL
(SELECT 'text' AS text1, 'text' AS text2, 34 AS value1, 54 AS value2, 12 AS value3, 78 AS value4,  1234 AS value FROM customer limit 1)
UNION ALL
(SELECT 'text' AS text1, 'text' AS text2, 43 AS value1, 76 AS value2, 21 AS value3, 40 AS value4,  1234 AS value FROM customer limit 1)
UNION ALL
(SELECT 'text' AS text1, 'text' AS text2, 40 AS value1, 20 AS value2, 12 AS value3, 43 AS value4, 1234 AS value FROM customer limit 1)
UNION ALL
(SELECT 'text' AS text1, 'text' AS text2, 65 AS value1, 21 AS value2, 87 AS value3, 45 AS value4,  1234 AS value FROM customer limit 1)]]>
</queryString>
<field name="text1" class="java.lang.String"/>
<field name="text2" class="java.lang.String"/>
<field name="value1" class="java.lang.Integer"/>
<field name="value2" class="java.lang.Integer"/>
<field name="value3" class="java.lang.Integer"/>
<field name="value4" class="java.lang.Integer"/>
<field name="value" class="java.lang.Integer"/>
<title>
<band height="30" splitType="Stretch">
<textField>
<reportElement x="0" y="0" width="555" height="30" uuid="afa9e0e5-7363-4dd3-9b8f-cf0b78ac465d"/>
<textElement textAlignment="Center" verticalAlignment="Middle">
<font size="18" isBold="true"/>
</textElement>
<textFieldExpression><![CDATA["Spark Line Widget Graph Demo"]]></textFieldExpression>
</textField>
</band>
</title>
<columnHeader>
<band height="30" splitType="Stretch">
<staticText>
<reportElement x="0" y="0" width="100" height="30" uuid="e9309669-8240-4ba6-99ca-5dcb335ac043"/>
<textElement textAlignment="Center" verticalAlignment="Middle">
<font isBold="true"/>
</textElement>
<text><![CDATA[Text1]]></text>
</staticText>
<staticText>
<reportElement x="100" y="0" width="100" height="30" uuid="be44cc9b-56da-4d81-93d4-2f41f83f2fb9"/>
<textElement textAlignment="Center" verticalAlignment="Middle">
<font isBold="true"/>
</textElement>
<text><![CDATA[Text2]]></text>
</staticText>
<staticText>
<reportElement x="400" y="0" width="150" height="30" uuid="d0b9756c-cd17-46d7-ae12-813f35f8fbf0"/>
<textElement textAlignment="Center" verticalAlignment="Middle">
<font isBold="true"/>
</textElement>
<text><![CDATA[Value]]></text>
</staticText>
<staticText>
<reportElement x="200" y="0" width="200" height="30" uuid="723477ea-8530-4357-84a1-952cc53ddb03"/>
<textElement textAlignment="Center" verticalAlignment="Middle">
<font isBold="true"/>
</textElement>
<text><![CDATA[Spark Line Graph]]></text>
</staticText>
</band>
</columnHeader>
<detail>
<band height="38" splitType="Stretch">
<componentElement>
<reportElement isPrintRepeatedValues="false" x="200" y="0" width="200" height="30" uuid="e6e7f751-bf9e-4678-918c-e9cf18584ec4">
<property name="com.jaspersoft.studio.unit.y" value="pixel"/>
</reportElement>
<fw:sparkLine xmlns:fw="http://jaspersoft.com/fusion" xsi:schemaLocation="http://jaspersoft.com/fusion http://jaspersoft.com/schema/fusion.xsd">
<fw:widgetProperty name="showCloseValue">
<fw:propertyExpression><![CDATA[Boolean.FALSE]]></fw:propertyExpression>
</fw:widgetProperty>
<fw:widgetProperty name="showHighLowValue">
<fw:propertyExpression><![CDATA[Boolean.FALSE]]></fw:propertyExpression>
</fw:widgetProperty>
<fw:widgetProperty name="showLowAnchor">
<fw:propertyExpression><![CDATA[Boolean.TRUE]]></fw:propertyExpression>
</fw:widgetProperty>
<fw:widgetProperty name="showCloseAnchor">
<fw:propertyExpression><![CDATA[Boolean.TRUE]]></fw:propertyExpression>
</fw:widgetProperty>
<fw:widgetProperty name="anchorColor">
<fw:propertyExpression><![CDATA[new java.awt.Color(-16154438)]]></fw:propertyExpression>
</fw:widgetProperty>
<fw:widgetProperty name="anchorRadius">
<fw:propertyExpression><![CDATA[new Integer(2)]]></fw:propertyExpression>
</fw:widgetProperty>
<fw:widgetProperty name="showHighAnchor">
<fw:propertyExpression><![CDATA[Boolean.TRUE]]></fw:propertyExpression>
</fw:widgetProperty>
<fw:widgetProperty name="showOpenAnchor">
<fw:propertyExpression><![CDATA[Boolean.TRUE]]></fw:propertyExpression>
</fw:widgetProperty>
<fw:widgetProperty name="openColor">
<fw:propertyExpression><![CDATA[new java.awt.Color(-16759166)]]></fw:propertyExpression>
</fw:widgetProperty>
<fw:widgetProperty name="closeColor">
<fw:propertyExpression><![CDATA[new java.awt.Color(-16759166)]]></fw:propertyExpression>
</fw:widgetProperty>
<fw:widgetProperty name="highColor">
<fw:propertyExpression><![CDATA[new java.awt.Color(-16759166)]]></fw:propertyExpression>
</fw:widgetProperty>
<fw:widgetProperty name="lowColor">
<fw:propertyExpression><![CDATA[new java.awt.Color(-16759166)]]></fw:propertyExpression>
</fw:widgetProperty>
<fw:widgetProperty name="lineColor">
<fw:propertyExpression><![CDATA[new java.awt.Color(-10987173)]]></fw:propertyExpression>
</fw:widgetProperty>
<fw:widgetProperty name="lineThickness">
<fw:propertyExpression><![CDATA[new Integer(1)]]></fw:propertyExpression>
</fw:widgetProperty>
<fw:widgetProperty name="anchorSides">
<fw:propertyExpression><![CDATA[new Integer(0)]]></fw:propertyExpression>
</fw:widgetProperty>
<fw:widgetProperty name="showBorder">
<fw:propertyExpression><![CDATA[Boolean.FALSE]]></fw:propertyExpression>
</fw:widgetProperty>
<fw:widgetProperty name="borderColor">
<fw:propertyExpression><![CDATA[new java.awt.Color(-1)]]></fw:propertyExpression>
</fw:widgetProperty>
<fw:widgetProperty name="borderThickness">
<fw:propertyExpression><![CDATA[new Integer(0)]]></fw:propertyExpression>
</fw:widgetProperty>
<fw:widgetProperty name="bgColor">
<fw:propertyExpression><![CDATA[new java.awt.Color(-2105118)]]></fw:propertyExpression>
</fw:widgetProperty>
<fw:widgetProperty name="periodLength">
<fw:propertyExpression><![CDATA[new Integer(0)]]></fw:propertyExpression>
</fw:widgetProperty>
<fw:widgetProperty name="periodColor">
<fw:propertyExpression><![CDATA[new java.awt.Color(-1)]]></fw:propertyExpression>
</fw:widgetProperty>
<fw:widgetProperty name="drawAnchors">
<fw:propertyExpression><![CDATA[Boolean.TRUE]]></fw:propertyExpression>
</fw:widgetProperty>
<fw:widgetProperty name="showOpenValue">
<fw:propertyExpression><![CDATA[Boolean.FALSE]]></fw:propertyExpression>
</fw:widgetProperty>
<fw:widgetProperty name="connectNullData">
<fw:propertyExpression><![CDATA[Boolean.FALSE]]></fw:propertyExpression>
</fw:widgetProperty>
<fw:valuesDataset>
<dataset resetType="None"/>
<fw:valueExpression><![CDATA[$F{value1}]]></fw:valueExpression>
<fw:valueExpression><![CDATA[$F{value2}]]></fw:valueExpression>
<fw:valueExpression><![CDATA[$F{value3}]]></fw:valueExpression>
<fw:valueExpression><![CDATA[$F{value4}]]></fw:valueExpression>
</fw:valuesDataset>
</fw:sparkLine>
</componentElement>
<textField>
<reportElement x="0" y="0" width="100" height="30" uuid="4f213fe8-8d1e-449c-87ba-ae38a3dbad53"/>
<textElement textAlignment="Center" verticalAlignment="Middle">
<font isBold="false"/>
</textElement>
<textFieldExpression><![CDATA[$F{text1}]]></textFieldExpression>
</textField>
<textField>
<reportElement x="100" y="0" width="100" height="30" uuid="d6db57ae-f3e8-4a49-beb8-61f7e2d40600"/>
<textElement textAlignment="Center" verticalAlignment="Middle">
<font isBold="false"/>
</textElement>
<textFieldExpression><![CDATA[$F{text2}]]></textFieldExpression>
</textField>
<textField>
<reportElement x="400" y="0" width="150" height="30" uuid="afb01f97-c840-4687-b167-1a4152cfd1f2"/>
<textElement textAlignment="Center" verticalAlignment="Middle"/>
<textFieldExpression><![CDATA[$F{value}]]></textFieldExpression>
</textField>
</band>
</detail>
</jasperReport>

I hope this example helps someone in community.! 

- Sadakar Pochampalli 

Tip: Conditional colors of bars in HTML(high charts) column or bar graphs without category values (or) SeriesItemProperty usage to display conditional colors of bars in Jasper reports

Hi folks,

Did you ever had a need of displaying column chart without having category from database ?
Did you ever want to have 4 fields of query output to be plotted as bars ?

Here we go.!
Let's say the query output format to be plotted as bars as follows

Query:
SELECT 100 AS Measure1, 200 AS Measure2, 300 AS Measure3, 400 AS Measure4 FROM customer limit 1

Output:
Measure1   Measure2   Measure3   Measure4
100               200              300              400

Image may be NSFW.
Clik here to view.

Usually, in jasper column graphs to get bars we write query in such a way that the output should come as below

field1      field2
category 100
category 200
category 300
category 400
and it gets the same color (by default blue incase of highcharts bars) as it has category field. 

Incase of only measures, we add them as individual measures in the chart Measures section as shown in below image. 

and when we preview the graph it would get different colors for each of the bar as the graph would plotted based on series although we don't have any series or for empty series.

In this cases, if we want to apply conditional colors on Measures, it can be done in the Advanced properties of each of the measures.

for instance, to apply conditional color on Measure1,
1) Double click on Measure1
2) In the popped up window select "Advanced properties".
3) Click on "Add" button
4) Select "SeriesItemProperty"in the dropdown of "Contributer".
5)  Give "color"as name in "Property Name"
6) Now, observe there are 4 ways like "Use constant Value", "Use bucket value", "Use Measure Value" and "Use Expression".
  As we don't have to deal with categories, we ignore "Use Bucket Value" property section. In usual cases of conditional colors we work with it. And the constant value and Use Measure is not the scope. Ultimately we need to use "Use Expression" property. Let's click on it to open it's expression editor and write below code of "Measure1"

($F{measure1}>=00  && $F{measure1} <=100 )? "red": ($F{measure1}>=101 &&  $F{measure1} <=200 ) ? "yellow":($F{measure1}>=201 &&  $F{measure1} <=300 ) ?"green":"blue"

Repeat the same steps of rest of the measures i.e., for Measure2, Measure3, Measure4. 

Based on the values range we provide different colors as shown in above image. In this case, I used 4 columns to plot and whenever the values meets the range provided each of the bar display either "red", "yellow", "green" or "blue". 

Note that in the sample output below I made the query to get 4 different colors for 4 bars but if you have the same value for any other measures it would get the same color. (look at case2 or case3 sample outputs below)

Sample output: case 1
SELECT 100 AS Measure1, 200 AS Measure2, 300 AS Measure3, 400 AS Measure4 FROM customer limit 1


Sample output : case 2 
SELECT 100 AS Measure1, 200 AS Measure2, 300 AS Measure3, 100 AS Measure4 FROM customer limit 1
Sample output : case 3
SELECT 300 AS Measure1, 200 AS Measure2, 300 AS Measure3, 300 AS Measure4 FROM customer limit 1
I hope this helps someone in community.!

- Sadakar Pochampalli

JRXML (Supports from 6.4.2 Professional version)
<?xml version="1.0" encoding="UTF-8"?>
<!-- Created with Jaspersoft Studio version 6.4.2.final using JasperReports Library version 6.4.1  -->
<jasperReport xmlns="http://jasperreports.sourceforge.net/jasperreports" xmlns:xsi="http://www.w3.org/2001/XMLSchema-instance" xsi:schemaLocation="http://jasperreports.sourceforge.net/jasperreports http://jasperreports.sourceforge.net/xsd/jasperreport.xsd" name="Custom colors for bars" pageWidth="595" pageHeight="842" columnWidth="555" leftMargin="20" rightMargin="20" topMargin="20" bottomMargin="20" uuid="c6392b13-e801-4f23-97b3-c1721031bd19">
<property name="com.jaspersoft.studio.data.defaultdataadapter" value="foodmartlatha"/>
<property name="com.jaspersoft.studio.data.sql.tables" value=""/>
<property name="ireport.jasperserver.url" value="http://localhost:8080/jasperserver-pro/"/>
<property name="ireport.jasperserver.user" value="superuser"/>
<property name="ireport.jasperserver.report.resource" value="/EarthlySystems/Custom_colors_for_bars_files/main_jrxml"/>
<property name="ireport.jasperserver.reportUnit" value="/EarthlySystems/Custom_colors_for_bars"/>
<queryString>
<![CDATA[SELECT 100 AS Measure1, 200 AS Measure2, 300 AS Measure3, 400 AS Measure4 FROM customer limit 1]]>
</queryString>
<field name="measure1" class="java.lang.Integer"/>
<field name="measure2" class="java.lang.Integer"/>
<field name="measure3" class="java.lang.Integer"/>
<field name="measure4" class="java.lang.Integer"/>
<background>
<band splitType="Stretch"/>
</background>
<summary>
<band height="270" splitType="Stretch">
<componentElement>
<reportElement x="0" y="0" width="555" height="270" uuid="9d82f52d-8919-49a1-b898-d54f4c9b74f1">
<property name="com.jaspersoft.jasperreports.highcharts.interactive" value="false"/>
<property name="com.jaspersoft.studio.unit.width" value="pixel"/>
<property name="com.jaspersoft.studio.unit.y" value="pixel"/>
</reportElement>
<hc:chart xmlns:hc="http://jaspersoft.com/highcharts" xsi:schemaLocation="http://jaspersoft.com/highcharts http://jaspersoft.com/schema/highcharts.xsd" type="Column">
<hc:chartSetting name="default">
<hc:chartProperty name="title.text" value=""/>
<hc:chartProperty name="credits.enabled" value="false"/>
<hc:chartProperty name="credits.href" value=""/>
<hc:chartProperty name="credits.text" value=""/>
<hc:chartProperty name="yAxis.title.text" value=""/>
<hc:chartProperty name="chart.zoomType" value="xy"/>
<hc:chartProperty name="legend.enabled_customSimpleMode" value="true"/>
<hc:chartProperty name="legend.enabled">
<hc:propertyExpression><![CDATA[false]]></hc:propertyExpression>
</hc:chartProperty>
<hc:chartProperty name="yAxis.gridLineWidth" value="0"/>
<hc:chartProperty name="yAxis.visible" value="false"/>
<hc:chartProperty name="yAxis.labels.enabled" value="false"/>
<hc:chartProperty name="yAxis.labels.format" value="{}"/>
<hc:chartProperty name="chart.backgroundColor" value="#FFFFFF"/>
<hc:chartProperty name="plotOptions.column.pointPadding" value="0.3"/>
<hc:chartProperty name="xAxis.labels.enabled" value="false"/>
<hc:chartProperty name="plotOptions.series.shadow_customSimpleMode" value="true"/>
<hc:chartProperty name="chart.spacingLeft_customSimpleMode" value="true"/>
<hc:chartProperty name="chart.spacingLeft">
<hc:propertyExpression><![CDATA[2]]></hc:propertyExpression>
</hc:chartProperty>
<hc:chartProperty name="chart.spacingRight_customSimpleMode" value="true"/>
<hc:chartProperty name="chart.spacingRight">
<hc:propertyExpression><![CDATA[2]]></hc:propertyExpression>
</hc:chartProperty>
<hc:chartProperty name="colors"/>
<hc:chartProperty name="xAxis.gridLineWidth" value="0"/>
<hc:chartProperty name="xAxis.lineWidth" value="0"/>
<hc:chartProperty name="xAxis.visible" value="false"/>
<hc:chartProperty name="yAxis.gridZIndex" value="0"/>
<hc:chartProperty name="yAxis.minorGridLineWidth" value="0"/>
<hc:chartProperty name="yAxis.lineWidth" value="0"/>
<hc:chartProperty name="plotOptions.column.borderColor">
<hc:propertyExpression><![CDATA[""]]></hc:propertyExpression>
</hc:chartProperty>
<hc:chartProperty name="xAxis.gridLineColor">
<hc:propertyExpression><![CDATA[""]]></hc:propertyExpression>
</hc:chartProperty>
<hc:chartProperty name="xAxis.lineColor" value="&quot;&quot;"/>
<hc:chartProperty name="xAxis.minorGridLineWidth" value="0"/>
<hc:chartProperty name="xAxis.minorTickLength" value="0"/>
<hc:chartProperty name="xAxis.tickWidth" value="0"/>
<hc:chartProperty name="xAxis.tickColor" value="&quot;&quot;"/>
<hc:chartProperty name="xAxis.labels.format" value="{}"/>
</hc:chartSetting>
<multiAxisData>
<multiAxisDataset>
<dataset resetType="None"/>
</multiAxisDataset>
<dataAxis axis="Rows">
<axisLevel name="EmptyCategory">
<labelExpression><![CDATA["Level Label expression"]]></labelExpression>
<axisLevelBucket class="java.lang.Comparable">
<bucketExpression><![CDATA["EmptyCategory"]]></bucketExpression>
</axisLevelBucket>
</axisLevel>
</dataAxis>
<dataAxis axis="Columns"/>
<multiAxisMeasure name="Measure1" class="java.lang.Number" calculation="Nothing">
<labelExpression><![CDATA["Measure1"]]></labelExpression>
<valueExpression><![CDATA[$F{measure1}]]></valueExpression>
</multiAxisMeasure>
<multiAxisMeasure name="Measure2" class="java.lang.Number" calculation="Nothing">
<labelExpression><![CDATA["Measure2"]]></labelExpression>
<valueExpression><![CDATA[$F{measure2}]]></valueExpression>
</multiAxisMeasure>
<multiAxisMeasure name="Measure3" class="java.lang.Number" calculation="Nothing">
<labelExpression><![CDATA["Measure3"]]></labelExpression>
<valueExpression><![CDATA[$F{measure3}]]></valueExpression>
</multiAxisMeasure>
<multiAxisMeasure name="Measure4" class="java.lang.Number" calculation="Nothing">
<labelExpression><![CDATA["Measure4"]]></labelExpression>
<valueExpression><![CDATA[$F{measure4}]]></valueExpression>
</multiAxisMeasure>
</multiAxisData>
<hc:series name="Measure1">
<hc:contributor name="SeriesItemProperty">
<hc:contributorProperty name="color" valueType="Expression">
<hc:valueExpression><![CDATA[($F{measure1}>=00  && $F{measure1} <=100 )? "red": ($F{measure1}>=101 &&  $F{measure1} <=200 ) ? "yellow":($F{measure1}>=201 &&  $F{measure1} <=300 ) ?"green":"blue"]]></hc:valueExpression>
</hc:contributorProperty>
</hc:contributor>
</hc:series>
<hc:series name="Measure2">
<hc:contributor name="SeriesItemProperty">
<hc:contributorProperty name="color" valueType="Expression">
<hc:valueExpression><![CDATA[($F{measure2}>=00  && $F{measure2} <=100 )? "red": ($F{measure2}>=101 &&  $F{measure2} <=200 ) ? "yellow":($F{measure2}>=201 &&  $F{measure2} <=300 ) ?"green":"blue"]]></hc:valueExpression>
</hc:contributorProperty>
</hc:contributor>
</hc:series>
<hc:series name="Measure3">
<hc:contributor name="SeriesItemProperty">
<hc:contributorProperty name="color" valueType="Expression">
<hc:valueExpression><![CDATA[($F{measure3}>=00  && $F{measure3} <=100 )? "red": ($F{measure3}>=101 &&  $F{measure3} <=200 ) ? "yellow":($F{measure3}>=201 &&  $F{measure3} <=300 ) ?"green":"blue"]]></hc:valueExpression>
</hc:contributorProperty>
</hc:contributor>
</hc:series>
<hc:series name="Measure4">
<hc:contributor name="SeriesItemProperty">
<hc:contributorProperty name="color" valueType="Expression">
<hc:valueExpression><![CDATA[($F{measure4}>=00  && $F{measure4} <=100 )? "red": ($F{measure4}>=101 &&  $F{measure4} <=200 ) ? "yellow":($F{measure4}>=201 &&  $F{measure4} <=300 ) ?"green":"blue"]]></hc:valueExpression>
</hc:contributorProperty>
</hc:contributor>
</hc:series>
</hc:chart>
</componentElement>
</band>
</summary>
</jasperReport>

Horizontal bullet widget visualization example in Jasper reports 6.4.2 or later

Hi folks, 

In this page, you would see how to work with Horizontal bullet widget that should look like as shown in below sample output. 
Bullet widget takes two values.
1) Bullet Value
2) Target Value

Using this visualization one can plot a value against a target having different ranges.

Sample query for this visualization is : 
SELECT  47 AS value, 78 AS target FROM customer limit 1

In the widget properties provide these values as shown in below image.

For color range, provide min and max values as follows

red --> min=0 max=30
yellow --> min=31 max=45
green --> min =46 max=85
blue --> min=86 max=100

To get the exact look and feel as shown in top of the post, play with Widget properties
For instance, below image would give an idea


Save your report and preview the visualization. This way, the desired output can be visualized in jasper reports using Horizontal bullet widget.

- Sadakar Pochampalli

JRXML (Supports from 6.4.2 professional jasper studio, database : "foodmart" db of postgres)

<?xml version="1.0" encoding="UTF-8"?>
<!-- Created with Jaspersoft Studio version 6.4.2.final using JasperReports Library version 6.4.1  -->
<jasperReport xmlns="http://jasperreports.sourceforge.net/jasperreports" xmlns:xsi="http://www.w3.org/2001/XMLSchema-instance" xsi:schemaLocation="http://jasperreports.sourceforge.net/jasperreports http://jasperreports.sourceforge.net/xsd/jasperreport.xsd" name="BulletChart" pageWidth="700" pageHeight="842" columnWidth="660" leftMargin="20" rightMargin="20" topMargin="20" bottomMargin="20" uuid="ce0d4c3e-a968-4446-bbf4-b5ee95e7a1d2">
<property name="com.jaspersoft.studio.unit." value="pixel"/>
<property name="com.jaspersoft.studio.unit.pageHeight" value="pixel"/>
<property name="com.jaspersoft.studio.unit.pageWidth" value="pixel"/>
<property name="com.jaspersoft.studio.unit.topMargin" value="pixel"/>
<property name="com.jaspersoft.studio.unit.bottomMargin" value="pixel"/>
<property name="com.jaspersoft.studio.unit.leftMargin" value="pixel"/>
<property name="com.jaspersoft.studio.unit.rightMargin" value="pixel"/>
<property name="com.jaspersoft.studio.unit.columnWidth" value="pixel"/>
<property name="com.jaspersoft.studio.unit.columnSpacing" value="pixel"/>
<property name="com.jaspersoft.studio.data.defaultdataadapter" value="foodmartlatha"/>
<property name="com.jaspersoft.studio.data.sql.tables" value=""/>
<property name="ireport.jasperserver.url" value="http://localhost:8080/jasperserver-pro/"/>
<property name="ireport.jasperserver.user" value="superuser"/>
<property name="ireport.jasperserver.report.resource" value="/EarthlySystems/Horizontal_Bullet_Widget_Chart_files/main_jrxml"/>
<property name="ireport.jasperserver.reportUnit" value="/EarthlySystems/Horizontal_Bullet_Widget_Chart"/>
<queryString>
<![CDATA[SELECT  47 AS value, 78 AS target FROM customer limit 1]]>
</queryString>
<field name="value" class="java.lang.Integer"/>
<field name="target" class="java.lang.Integer"/>
<background>
<band splitType="Stretch"/>
</background>
<summary>
<band height="116" splitType="Stretch">
<componentElement>
<reportElement x="0" y="71" width="640" height="45" uuid="10f1d42b-9236-40d3-aee0-cd4ab0954674">
<property name="com.jaspersoft.studio.unit.height" value="pixel"/>
</reportElement>
<fw:horizontalBullet xmlns:fw="http://jaspersoft.com/fusion" xsi:schemaLocation="http://jaspersoft.com/fusion http://jaspersoft.com/schema/fusion.xsd">
<fw:widgetProperty name="showLimits">
<fw:propertyExpression><![CDATA[Boolean.FALSE]]></fw:propertyExpression>
</fw:widgetProperty>
<fw:widgetProperty name="showTickValues">
<fw:propertyExpression><![CDATA[Boolean.FALSE]]></fw:propertyExpression>
</fw:widgetProperty>
<fw:widgetProperty name="setAdaptiveMin">
<fw:propertyExpression><![CDATA[Boolean.FALSE]]></fw:propertyExpression>
</fw:widgetProperty>
<fw:widgetProperty name="showTickMarks">
<fw:propertyExpression><![CDATA[Boolean.FALSE]]></fw:propertyExpression>
</fw:widgetProperty>
<fw:widgetProperty name="showValue">
<fw:propertyExpression><![CDATA[Boolean.FALSE]]></fw:propertyExpression>
</fw:widgetProperty>
<fw:widgetProperty name="showShadow">
<fw:propertyExpression><![CDATA[Boolean.FALSE]]></fw:propertyExpression>
</fw:widgetProperty>
<fw:widgetProperty name="ticksOnRight">
<fw:propertyExpression><![CDATA[Boolean.FALSE]]></fw:propertyExpression>
</fw:widgetProperty>
<fw:widgetProperty name="animation">
<fw:propertyExpression><![CDATA[Boolean.FALSE]]></fw:propertyExpression>
</fw:widgetProperty>
<fw:widgetProperty name="caption">
<fw:propertyExpression><![CDATA["rate of interest%"]]></fw:propertyExpression>
</fw:widgetProperty>
<fw:widgetProperty name="subCaption">
<fw:propertyExpression><![CDATA["(avg interest)"]]></fw:propertyExpression>
</fw:widgetProperty>
<fw:widgetProperty name="borderColor">
<fw:propertyExpression><![CDATA[new java.awt.Color(-1)]]></fw:propertyExpression>
</fw:widgetProperty>
<fw:widgetProperty name="paletteThemeColor">
<fw:propertyExpression><![CDATA[new java.awt.Color(-16777216)]]></fw:propertyExpression>
</fw:widgetProperty>
<fw:widgetProperty name="plotBorderColor">
<fw:propertyExpression><![CDATA[new java.awt.Color(-1)]]></fw:propertyExpression>
</fw:widgetProperty>
<fw:widgetProperty name="bgColor">
<fw:propertyExpression><![CDATA[new java.awt.Color(-1)]]></fw:propertyExpression>
</fw:widgetProperty>
<fw:widgetProperty name="baseFontColor">
<fw:propertyExpression><![CDATA[new java.awt.Color(-16777216)]]></fw:propertyExpression>
</fw:widgetProperty>
<dataset/>
<fw:valueExpression><![CDATA[new Double($F{value})]]></fw:valueExpression>
<fw:targetExpression><![CDATA[new Double($F{target})]]></fw:targetExpression>
<fw:colorRange color="#FF0000">
<fw:minValueExpression><![CDATA[0]]></fw:minValueExpression>
<fw:maxValueExpression><![CDATA[30]]></fw:maxValueExpression>
<fw:labelExpression><![CDATA["color1"]]></fw:labelExpression>
</fw:colorRange>
<fw:colorRange color="#FFFF00">
<fw:minValueExpression><![CDATA[31]]></fw:minValueExpression>
<fw:maxValueExpression><![CDATA[45]]></fw:maxValueExpression>
<fw:labelExpression><![CDATA["color2"]]></fw:labelExpression>
</fw:colorRange>
<fw:colorRange color="#008000">
<fw:minValueExpression><![CDATA[45]]></fw:minValueExpression>
<fw:maxValueExpression><![CDATA[85]]></fw:maxValueExpression>
<fw:labelExpression><![CDATA["color3"]]></fw:labelExpression>
</fw:colorRange>
<fw:colorRange color="#0000FF">
<fw:minValueExpression><![CDATA[86]]></fw:minValueExpression>
<fw:maxValueExpression><![CDATA[100]]></fw:maxValueExpression>
<fw:labelExpression><![CDATA["color4"]]></fw:labelExpression>
</fw:colorRange>
</fw:horizontalBullet>
</componentElement>
<textField>
<reportElement x="0" y="19" width="660" height="30" uuid="ec78046b-4fd5-4139-8ffe-1682459a7895"/>
<textElement textAlignment="Center" verticalAlignment="Middle">
<font size="18" isBold="true"/>
</textElement>
<textFieldExpression><![CDATA["Horizontal Bullet Widget Visualization Demo"]]></textFieldExpression>
</textField>
</band>
</summary>
</jasperReport>

Tip: Merge column header cells in Table component of Jasper reports

Hi folks,

To merge the column headers in jasper reports table component, select the columns from "Column Header" section of "Table Outline"  and right click on them and then click on "Group columns".

It would add empty space on top of existing column labels and now you can keep an additional text field on top of the grouped columns which would look like a merged cell.

The outline of grouped column will be as follows.

Sample 


- Thank you for stopping by, hope it helps someone in community.

Until Next Post
- Sadakar Pochampalli

Tip : Return variable(s) from Table component Dataset to display on Title band of report in Japsersoft reports

Hi folks, 

A table component in Jaspersoft requires a data set to be created and it can be done as usual but what if you want to display the calculations from table component outside of it's area on the same report or may be in some other report. 

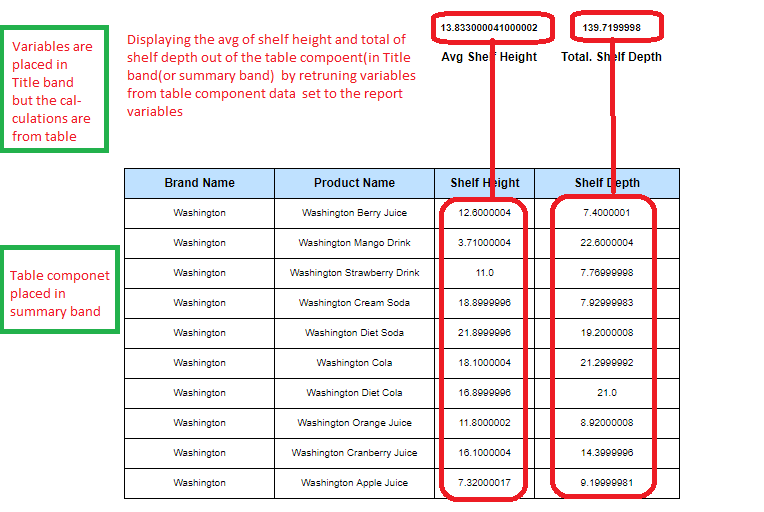
We use "Return variables" concept on data sets that are being used by the components. For instance, below image is an example to display the avg shelf height and total shelf depth columns of table component outside of its(table) area. i.e, display the avg and total, say in "Title" band or say at some specific portion in Summary band. 

(Click on image to get best view of the content written over it)

To accomplish it, create variables in Dataset of the table component. 

For instance, Calculating Avg Shelf 

1) Create a variable in table data set, say "tableVarShelfHeight" of type Double in my case and the Calculation is Average and the Expression is $F{shelf_height} and IncrementType as None and Reset Type as Report.

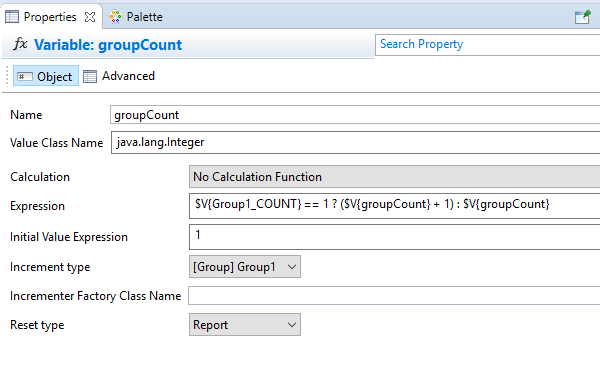
2) Create a another variable in report variables, say "reportVarShelfHeight", of type Double and with Calculation as "No Calculation Function" and IncrementType as None and Reset Type as Report


3) Now, click on the Table component, and in its properties be on "Dataset" section and then click on the button called "Return Variables". In the pop-up window opened click on "Add" button to add then give the values for "From Variable" as "tableVarShelfHeight" and "To Variable"as "reportVarShelfHeight".

4) Now, from the report outline, and from the variables drag on drop the "reportVarShelfHeight" to the "Title" band and change its "Evaluation Time" as "Report" (by default it would be "None")

5) Follow, the same steps to create tableVarShelfDepth variable for total. 

This way, a calculation created in data sets of table component can be utilized on Title band of the same report. 

Want to look at the explained example instantly, copy and paste below JRXML in your test JRXML and observe the implementation.!

Hope it would be some help to you.!

Until Next Tip/Post, 
Sadakar Pochampalli 

JRXML: (Works in Jaspersoft Studio 6.4.2 professional)
<?xml version="1.0" encoding="UTF-8"?>
<!-- Created with Jaspersoft Studio version 6.4.2.final using JasperReports Library version 6.4.1  -->
<jasperReport xmlns="http://jasperreports.sourceforge.net/jasperreports" xmlns:xsi="http://www.w3.org/2001/XMLSchema-instance" xsi:schemaLocation="http://jasperreports.sourceforge.net/jasperreports http://jasperreports.sourceforge.net/xsd/jasperreport.xsd" name="TableComponentReturnVariable" pageWidth="595" pageHeight="842" columnWidth="555" leftMargin="20" rightMargin="20" topMargin="20" bottomMargin="20" uuid="076eb3bf-3e45-4383-aab2-41f7a7ab9677">
<property name="com.jaspersoft.studio.data.defaultdataadapter" value="foodmart"/>
<property name="com.jaspersoft.studio.data.sql.tables" value=""/>
<property name="ireport.jasperserver.url" value="http://localhost:8080/jasperserver-pro/"/>
<property name="ireport.jasperserver.user" value="superuser"/>
<property name="ireport.jasperserver.report.resource" value="/EarthlySystems/TableComponentReturnVariable_files/main_jrxml"/>
<property name="ireport.jasperserver.reportUnit" value="/EarthlySystems/TableComponentReturnVariable"/>
<style name="Table_TH" mode="Opaque" backcolor="#F0F8FF">
<box>
<pen lineWidth="0.5" lineColor="#000000"/>
<topPen lineWidth="0.5" lineColor="#000000"/>
<leftPen lineWidth="0.5" lineColor="#000000"/>
<bottomPen lineWidth="0.5" lineColor="#000000"/>
<rightPen lineWidth="0.5" lineColor="#000000"/>
</box>
</style>
<style name="Table_CH" mode="Opaque" backcolor="#BFE1FF">
<box>
<pen lineWidth="0.5" lineColor="#000000"/>
<topPen lineWidth="0.5" lineColor="#000000"/>
<leftPen lineWidth="0.5" lineColor="#000000"/>
<bottomPen lineWidth="0.5" lineColor="#000000"/>
<rightPen lineWidth="0.5" lineColor="#000000"/>
</box>
</style>
<style name="Table_TD" mode="Opaque" backcolor="#FFFFFF">
<box>
<pen lineWidth="0.5" lineColor="#000000"/>
<topPen lineWidth="0.5" lineColor="#000000"/>
<leftPen lineWidth="0.5" lineColor="#000000"/>
<bottomPen lineWidth="0.5" lineColor="#000000"/>
<rightPen lineWidth="0.5" lineColor="#000000"/>
</box>
</style>
<subDataset name="Dataset1" uuid="13c73a68-84f9-4afb-8d85-c363df55edd5">
<property name="com.jaspersoft.studio.data.sql.tables" value=""/>
<property name="com.jaspersoft.studio.data.defaultdataadapter" value="foodmart"/>
<queryString language="SQL">
<![CDATA[SELECT * FROM product limit 10]]>
</queryString>
<field name="product_class_id" class="java.lang.Integer"/>
<field name="product_id" class="java.lang.Integer"/>
<field name="brand_name" class="java.lang.String"/>
<field name="product_name" class="java.lang.String"/>
<field name="sku" class="java.lang.Long"/>
<field name="srp" class="java.math.BigDecimal"/>
<field name="gross_weight" class="java.lang.Float"/>
<field name="net_weight" class="java.lang.Float"/>
<field name="recyclable_package" class="java.lang.Boolean"/>
<field name="low_fat" class="java.lang.Boolean"/>
<field name="units_per_case" class="java.lang.Integer"/>
<field name="cases_per_pallet" class="java.lang.Integer"/>
<field name="shelf_width" class="java.lang.Double"/>
<field name="shelf_height" class="java.lang.Double"/>
<field name="shelf_depth" class="java.lang.Double"/>
<variable name="tableVarShelfHeight" class="java.lang.Double" calculation="Average">
<variableExpression><![CDATA[$F{shelf_height}]]></variableExpression>
</variable>
<variable name="tableVarShelfDepth" class="java.lang.Double" calculation="Sum">
<variableExpression><![CDATA[$F{shelf_depth}]]></variableExpression>
</variable>
</subDataset>
<queryString>
<![CDATA[select 1 as one]]>
</queryString>
<field name="one" class="java.lang.Integer"/>
<variable name="reportVarShelfHeight" class="java.lang.Double"/>
<variable name="reportVarShelfDepth" class="java.lang.Double"/>
<background>
<band splitType="Stretch"/>
</background>
<summary>
<band height="155" splitType="Stretch">
<componentElement>
<reportElement x="0" y="95" width="555" height="60" uuid="fb230941-894f-49b6-a5db-33fd14e143ca">
<property name="com.jaspersoft.studio.layout" value="com.jaspersoft.studio.editor.layout.VerticalRowLayout"/>
<property name="com.jaspersoft.studio.table.style.table_header" value="Table_TH"/>
<property name="com.jaspersoft.studio.table.style.column_header" value="Table_CH"/>
<property name="com.jaspersoft.studio.table.style.detail" value="Table_TD"/>
</reportElement>
<jr:table xmlns:jr="http://jasperreports.sourceforge.net/jasperreports/components" xsi:schemaLocation="http://jasperreports.sourceforge.net/jasperreports/components http://jasperreports.sourceforge.net/xsd/components.xsd">
<datasetRun subDataset="Dataset1" uuid="e267dc57-7f5a-496a-afbe-4c501f7641c0">
<connectionExpression><![CDATA[$P{REPORT_CONNECTION}]]></connectionExpression>
<returnValue fromVariable="tableVarShelfHeight" toVariable="reportVarShelfHeight"/>
<returnValue fromVariable="tableVarShelfDepth" toVariable="reportVarShelfDepth"/>
</datasetRun>
<jr:column width="150" uuid="72c24377-f2d4-475b-a4e5-67e44a84e77e">
<property name="com.jaspersoft.studio.components.table.model.column.name" value="Column1"/>
<property name="com.jaspersoft.studio.unit.width" value="pixel"/>
<jr:columnHeader style="Table_CH" height="30">
<property name="com.jaspersoft.studio.unit.width" value="px"/>
<staticText>
<reportElement x="0" y="0" width="150" height="30" uuid="8fc092e9-c4c6-4852-b9f9-f0ba87058672"/>
<textElement textAlignment="Center" verticalAlignment="Middle">
<font size="12" isBold="true"/>
</textElement>
<text><![CDATA[Brand Name]]></text>
</staticText>
</jr:columnHeader>
<jr:detailCell style="Table_TD" height="30">
<textField>
<reportElement x="0" y="0" width="150" height="30" uuid="7b7ca06b-b091-49e4-88b3-2933d406b307"/>
<textElement textAlignment="Center" verticalAlignment="Middle"/>
<textFieldExpression><![CDATA[$F{brand_name}]]></textFieldExpression>
</textField>
</jr:detailCell>
</jr:column>
<jr:column width="160" uuid="c0ff827a-b508-4cb3-a56e-907dd5c6541b">
<property name="com.jaspersoft.studio.components.table.model.column.name" value="Column2"/>
<jr:columnHeader style="Table_CH" height="30">
<staticText>
<reportElement x="0" y="0" width="160" height="30" uuid="cfe5cfa6-a8c0-4e21-be9b-905f5a4c3b5f"/>
<textElement textAlignment="Center" verticalAlignment="Middle">
<font size="12" isBold="true"/>
</textElement>
<text><![CDATA[Product Name]]></text>
</staticText>
</jr:columnHeader>
<jr:detailCell style="Table_TD" height="30">
<textField>
<reportElement x="0" y="0" width="160" height="30" uuid="79e67174-3f79-4bd2-9431-382caef06859"/>
<textElement textAlignment="Center" verticalAlignment="Middle"/>
<textFieldExpression><![CDATA[$F{product_name}]]></textFieldExpression>
</textField>
</jr:detailCell>
</jr:column>
<jr:column width="100" uuid="d181aa89-109e-4611-a88d-b02987b5f843">
<property name="com.jaspersoft.studio.components.table.model.column.name" value="Column3"/>
<jr:columnHeader style="Table_CH" height="30">
<staticText>
<reportElement x="0" y="0" width="100" height="30" uuid="eccf9427-0a77-42d2-843c-45240add3380"/>
<textElement textAlignment="Center" verticalAlignment="Middle">
<font size="12" isBold="true"/>
</textElement>
<text><![CDATA[Shelf Height]]></text>
</staticText>
</jr:columnHeader>
<jr:detailCell style="Table_TD" height="30">
<textField>
<reportElement x="0" y="0" width="100" height="30" uuid="2bcee921-da1c-446b-b0d6-f7eabc9d1e09"/>
<textElement textAlignment="Center" verticalAlignment="Middle"/>
<textFieldExpression><![CDATA[$F{shelf_height}]]></textFieldExpression>
</textField>
</jr:detailCell>
</jr:column>
<jr:column width="145" uuid="bdaa807a-f7ad-4012-b785-2043e2f8b5ed">
<property name="com.jaspersoft.studio.components.table.model.column.name" value="Column4"/>
<jr:columnHeader style="Table_CH" height="30">
<staticText>
<reportElement x="0" y="0" width="145" height="30" uuid="b49b7a55-8b66-4008-9fa5-b8c7eef487c4"/>
<textElement textAlignment="Center" verticalAlignment="Middle">
<font size="12" isBold="true"/>
</textElement>
<text><![CDATA[Shelf Depth]]></text>
</staticText>
</jr:columnHeader>
<jr:detailCell style="Table_TD" height="30">
<textField>
<reportElement x="0" y="0" width="145" height="30" uuid="eaf798a6-92db-4d2a-bae4-cbb0a3fc3df1"/>
<textElement textAlignment="Center" verticalAlignment="Middle"/>
<textFieldExpression><![CDATA[$F{shelf_depth}]]></textFieldExpression>
</textField>
</jr:detailCell>
</jr:column>
</jr:table>
</componentElement>
<textField evaluationTime="Report">
<reportElement x="310" y="0" width="110" height="30" uuid="ae60e175-5e2b-41a9-97e4-e56d03e04879"/>
<textElement textAlignment="Center" verticalAlignment="Middle">
<font isBold="true"/>
</textElement>
<textFieldExpression><![CDATA[$V{reportVarShelfHeight}]]></textFieldExpression>
</textField>
<textField evaluationTime="Report">
<reportElement x="420" y="0" width="135" height="30" uuid="1ddf8337-b8ed-4d7f-a8b6-b3254ef08f1e"/>
<textElement textAlignment="Center" verticalAlignment="Middle">
<font isBold="true"/>
</textElement>
<textFieldExpression><![CDATA[$V{reportVarShelfDepth}]]></textFieldExpression>
</textField>
<textField>
<reportElement x="310" y="30" width="110" height="30" uuid="3400a3c6-b92f-4191-9a0f-c9e4277f6789"/>
<textElement textAlignment="Center" verticalAlignment="Middle">
<font size="12" isBold="true"/>
</textElement>
<textFieldExpression><![CDATA["Avg Shelf Height"]]></textFieldExpression>
</textField>
<textField>
<reportElement x="420" y="30" width="135" height="30" uuid="effa8104-837d-4dc8-b08a-76645fed513c"/>
<textElement textAlignment="Center" verticalAlignment="Middle">
<font size="12" isBold="true"/>
</textElement>
<textFieldExpression><![CDATA["Total. Shelf Depth"]]></textFieldExpression>
</textField>
</band>
</summary>
</jasperReport>

Tip : Vertical display of detailed records in jasper reports - convert rows as columns(alternative of cross tab)


Hi folks, 

In this tip, you would see how to convert sql rows into report columns. 
By default when you put text fields in detail band, you could see the report prints the query output in vertical order(row by row). There are some situations when your query results definite number of rows in output and need them to be displayed as horizontal view. 

In this case, usually one might think of cross tab implementation. This is fine upto some extent but working with cross tab is not always developer friendly hence instead of using it one can split the report into N number columns in reports properties and provide desired width for columns and then pull your fields one below to other. In the report advanced properties change Print Order property from Vertical to Horizontal and this would result converting rows output into columns that would look like a cross tab implementation. 

Design:

Query format/Sample query output


Sample output: 


JRXML: (Developed using 6.4.2 professional - it should also works in community[not tested])

<?xml version="1.0" encoding="UTF-8"?>
<!-- Created with Jaspersoft Studio version 6.4.2.final using JasperReports Library version 6.4.1  -->
<jasperReport xmlns="http://jasperreports.sourceforge.net/jasperreports" xmlns:xsi="http://www.w3.org/2001/XMLSchema-instance" xsi:schemaLocation="http://jasperreports.sourceforge.net/jasperreports http://jasperreports.sourceforge.net/xsd/jasperreport.xsd" name="columns" columnCount="5" printOrder="Horizontal" pageWidth="650" pageHeight="842" columnWidth="120" leftMargin="20" rightMargin="20" topMargin="20" bottomMargin="20" whenResourceMissingType="Error" uuid="adca597a-f8d3-4f9f-ae19-21b3272acdb9">
<property name="com.jaspersoft.studio.unit." value="pixel"/>
<property name="com.jaspersoft.studio.data.defaultdataadapter" value="foodmart"/>
<property name="com.jaspersoft.studio.data.sql.tables" value=""/>
<queryString>
<![CDATA[(SELECT 100 customerID, 'Sadakar' CustomerName, 'Hyd' CustomerCity FROM customer limit 1)
UNION ALL
(SELECT 101 customerID, 'Hasini' CustomerName, 'MNCL' CustomerCity FROM customer limit 1)
UNION ALL
(SELECT 102 customerID, 'Venkat' CustomerName, 'Banglore' CustomerCity FROM customer limit 1)
UNION ALL
(SELECT 103 customerID, 'Robert' CustomerName, 'Chenni' CustomerCity FROM customer limit 1)
UNION ALL
(SELECT 104 customerID, 'Soujanya' CustomerName, 'MMR' CustomerCity FROM customer limit 1)]]>
</queryString>
<field name="customerid" class="java.lang.Integer"/>
<field name="customername" class="java.lang.String"/>
<field name="customercity" class="java.lang.String"/>
<pageHeader>
<band height="46" splitType="Stretch">
<textField>
<reportElement x="0" y="0" width="610" height="46" uuid="217244d6-5976-4298-bf74-d5e93099b5c7"/>
<textElement textAlignment="Center" verticalAlignment="Middle">
<font size="16"/>
</textElement>
<textFieldExpression><![CDATA["Horizontal display of definite number of rows output like a cross tab view"]]></textFieldExpression>
</textField>
</band>
</pageHeader>
<detail>
<band height="93" splitType="Stretch">
<textField>
<reportElement x="0" y="3" width="100" height="30" uuid="160c2caa-87e8-4757-8b6d-7ff9daad46e8"/>
<textFieldExpression><![CDATA[$F{customerid}]]></textFieldExpression>
</textField>
<textField>
<reportElement x="0" y="33" width="100" height="30" uuid="91ef78c5-4eae-43a4-9f64-8a6848961018"/>
<textFieldExpression><![CDATA[$F{customername}]]></textFieldExpression>
</textField>
<textField>
<reportElement x="0" y="63" width="100" height="30" uuid="f3c5ce61-e141-409e-8b21-86d4cdbfd7e5"/>
<textFieldExpression><![CDATA[$F{customercity}]]></textFieldExpression>
</textField>
</band>
</detail>
</jasperReport>

TIBCO Jaspersoft 7.1 CE & EE release notes

Tip : Usage of COLUMN_NUMBER variable in Jaspersoft Studio reports

Hi folks,

Recently, I wrote about the usage of horizontal display (looks like vertical display) of sql output in jaspersoft studio at read it here.

At report level to display the row number with detail band we use "REPORT_COUNT" variable, what if you want to display the column numbers when displaying the records in horizontal view(looks like vertical) ?

Use "COLUMN_NUMBER" variable in a text expression. i.e., ${COLUMN_NUMBER}.


Watch video tutorial for the same example below(with voice)


Sample screenshot is shown in below: (An example of fixed number of customers to display)

(Click on image to get the best view)

Sample screenshot of the report design: 

(Click on image to get the best view)

Variable usage : 

(Click on image to get the best view)


JRXML: ( Supports in 6.4.2 Pro or later) - The example uses "foodmart" db of postgresql.

<?xml version="1.0" encoding="UTF-8"?>
<!-- Created with Jaspersoft Studio version 6.4.2.final using JasperReports Library version 6.4.1  -->
<jasperReport xmlns="http://jasperreports.sourceforge.net/jasperreports" xmlns:xsi="http://www.w3.org/2001/XMLSchema-instance" xsi:schemaLocation="http://jasperreports.sourceforge.net/jasperreports http://jasperreports.sourceforge.net/xsd/jasperreport.xsd" name="ColumnNumber" columnCount="10" printOrder="Horizontal" pageWidth="1000" pageHeight="240" columnWidth="100" leftMargin="0" rightMargin="0" topMargin="0" bottomMargin="0" uuid="4b5118e2-f385-4f14-a743-8c42ce6f64f8">
<property name="com.jaspersoft.studio.data.sql.tables" value=""/>
<property name="com.jaspersoft.studio.data.defaultdataadapter" value="foodmart"/>
<property name="com.jaspersoft.studio.unit." value="pixel"/>
<property name="com.jaspersoft.studio.unit.pageHeight" value="pixel"/>
<property name="com.jaspersoft.studio.unit.pageWidth" value="pixel"/>
<property name="com.jaspersoft.studio.unit.topMargin" value="pixel"/>
<property name="com.jaspersoft.studio.unit.bottomMargin" value="pixel"/>
<property name="com.jaspersoft.studio.unit.leftMargin" value="pixel"/>
<property name="com.jaspersoft.studio.unit.rightMargin" value="pixel"/>
<property name="com.jaspersoft.studio.unit.columnWidth" value="pixel"/>
<property name="com.jaspersoft.studio.unit.columnSpacing" value="pixel"/>
<queryString language="SQL">
<![CDATA[SELECT * FROM customer limit 10]]>
</queryString>
<field name="customer_id" class="java.lang.Integer"/>
<field name="account_num" class="java.lang.Long"/>
<field name="lname" class="java.lang.String"/>
<field name="fname" class="java.lang.String"/>
<field name="mi" class="java.lang.String"/>
<field name="address1" class="java.lang.String"/>
<field name="address2" class="java.lang.String"/>
<field name="address3" class="java.lang.String"/>
<field name="address4" class="java.lang.String"/>
<field name="city" class="java.lang.String"/>
<field name="state_province" class="java.lang.String"/>
<field name="postal_code" class="java.lang.String"/>
<field name="country" class="java.lang.String"/>
<field name="customer_region_id" class="java.lang.Integer"/>
<field name="phone1" class="java.lang.String"/>
<field name="phone2" class="java.lang.String"/>
<field name="birthdate" class="java.sql.Date"/>
<field name="marital_status" class="java.lang.String"/>
<field name="yearly_income" class="java.lang.String"/>
<field name="gender" class="java.lang.String"/>
<field name="total_children" class="java.lang.Integer"/>
<field name="num_children_at_home" class="java.lang.Integer"/>
<field name="education" class="java.lang.String"/>
<field name="date_accnt_opened" class="java.sql.Date"/>
<field name="member_card" class="java.lang.String"/>
<field name="occupation" class="java.lang.String"/>
<field name="houseowner" class="java.lang.String"/>
<field name="num_cars_owned" class="java.lang.Integer"/>
<field name="fullname" class="java.lang.String"/>
<title>
<band height="30">
<textField>
<reportElement mode="Opaque" x="0" y="0" width="1000" height="30" backcolor="#C4BFBE" uuid="f5f8aa2e-b32c-4e01-9cd4-eced9709e8e5">
<property name="com.jaspersoft.studio.unit.height" value="pixel"/>
</reportElement>
<textElement textAlignment="Center" verticalAlignment="Middle">
<font size="20" isBold="true"/>
</textElement>
<textFieldExpression><![CDATA["COLUMN_NUMBER variable usage"]]></textFieldExpression>
</textField>
</band>
</title>
<detail>
<band height="210" splitType="Stretch">
<property name="com.jaspersoft.studio.unit.height" value="pixel"/>
<textField>
<reportElement x="0" y="30" width="100" height="30" uuid="c06c9319-9184-44f7-93ea-727751f38877"/>
<box leftPadding="5">
<topPen lineWidth="1.0" lineStyle="Solid" lineColor="#000000"/>
<leftPen lineWidth="1.0" lineStyle="Solid" lineColor="#000000"/>
<bottomPen lineWidth="1.0" lineStyle="Solid" lineColor="#000000"/>
<rightPen lineWidth="1.0" lineStyle="Solid" lineColor="#000000"/>
</box>
<textElement textAlignment="Left" verticalAlignment="Middle"/>
<textFieldExpression><![CDATA[$F{customer_id}]]></textFieldExpression>
</textField>
<textField>
<reportElement x="0" y="60" width="100" height="30" uuid="64bcc1b5-899e-4433-a3a7-b73e8d4a5dfc"/>
<box leftPadding="5">
<topPen lineWidth="1.0" lineStyle="Solid" lineColor="#000000"/>
<leftPen lineWidth="1.0" lineStyle="Solid" lineColor="#000000"/>
<bottomPen lineWidth="1.0" lineStyle="Solid" lineColor="#000000"/>
<rightPen lineWidth="1.0" lineStyle="Solid" lineColor="#000000"/>
</box>
<textElement textAlignment="Left" verticalAlignment="Middle"/>
<textFieldExpression><![CDATA[$F{fullname}]]></textFieldExpression>
</textField>
<textField>
<reportElement x="0" y="90" width="100" height="30" uuid="6628fe84-1bc9-42c2-9d5f-d08e0f9b891a"/>
<box leftPadding="5">
<topPen lineWidth="1.0" lineStyle="Solid" lineColor="#000000"/>
<leftPen lineWidth="1.0" lineStyle="Solid" lineColor="#000000"/>
<bottomPen lineWidth="1.0" lineStyle="Solid" lineColor="#000000"/>
<rightPen lineWidth="1.0" lineStyle="Solid" lineColor="#000000"/>
</box>
<textElement textAlignment="Left" verticalAlignment="Middle"/>
<textFieldExpression><![CDATA[$F{country}]]></textFieldExpression>
</textField>
<textField>
<reportElement x="0" y="120" width="100" height="30" uuid="0b1a3b1f-3878-4e64-a5fc-ca33cda52c66"/>
<box leftPadding="5">
<topPen lineWidth="1.0" lineStyle="Solid" lineColor="#000000"/>
<leftPen lineWidth="1.0" lineStyle="Solid" lineColor="#000000"/>
<bottomPen lineWidth="1.0" lineStyle="Solid" lineColor="#000000"/>
<rightPen lineWidth="1.0" lineStyle="Solid" lineColor="#000000"/>
</box>
<textElement textAlignment="Left" verticalAlignment="Middle"/>
<textFieldExpression><![CDATA[$F{yearly_income}]]></textFieldExpression>
</textField>
<textField>
<reportElement x="0" y="150" width="100" height="30" uuid="33c68e73-de62-4287-9154-9a1f76730d3a"/>
<box leftPadding="5">
<topPen lineWidth="1.0" lineStyle="Solid" lineColor="#000000"/>
<leftPen lineWidth="1.0" lineStyle="Solid" lineColor="#000000"/>
<bottomPen lineWidth="1.0" lineStyle="Solid" lineColor="#000000"/>
<rightPen lineWidth="1.0" lineStyle="Solid" lineColor="#000000"/>
</box>
<textElement textAlignment="Left" verticalAlignment="Middle"/>
<textFieldExpression><![CDATA[$F{gender}]]></textFieldExpression>
</textField>
<textField>
<reportElement x="0" y="180" width="100" height="30" uuid="a8e7cf7d-26de-4078-ae16-c9e6322bdd0c"/>
<box leftPadding="5">
<topPen lineWidth="1.0" lineStyle="Solid" lineColor="#000000"/>
<leftPen lineWidth="1.0" lineStyle="Solid" lineColor="#000000"/>
<bottomPen lineWidth="1.0" lineStyle="Solid" lineColor="#000000"/>
<rightPen lineWidth="1.0" lineStyle="Solid" lineColor="#000000"/>
</box>
<textElement textAlignment="Left" verticalAlignment="Middle"/>
<textFieldExpression><![CDATA[$F{occupation}]]></textFieldExpression>
</textField>
<textField>
<reportElement mode="Opaque" x="0" y="0" width="100" height="30" backcolor="#E3E1E1" uuid="dc7a89ed-2fe5-4b5a-a7c2-ec32148e009a"/>
<box>
<topPen lineWidth="1.0" lineStyle="Solid" lineColor="#000000"/>
<leftPen lineWidth="1.0" lineStyle="Solid" lineColor="#000000"/>
<bottomPen lineWidth="1.0" lineStyle="Solid" lineColor="#000000"/>
<rightPen lineWidth="1.0" lineStyle="Solid" lineColor="#000000"/>
</box>
<textElement textAlignment="Center" verticalAlignment="Middle">
<font isBold="true"/>
</textElement>
<textFieldExpression><![CDATA["Customer"+""+$V{COLUMN_NUMBER}]]></textFieldExpression>
</textField>
</band>
</detail>
</jasperReport>

Tip : Relatively increase the height of the less text contained field with the maximum text contained field in jaspersoft reports

Hi, 

Expected output should be as shown in below image. 

Solution: (Read the image properties - outlined red in color)


Related article can be found here : 
http://jasper-bi-suite.blogspot.com/2016/03/tip-detail-overflow-vs-streach-with.html

JRXML(Supports in 6.4.2 professional version)

<?xml version="1.0" encoding="UTF-8"?>
<!-- Created with Jaspersoft Studio version 6.4.2.final using JasperReports Library version 6.4.1  -->
<jasperReport xmlns="http://jasperreports.sourceforge.net/jasperreports" xmlns:xsi="http://www.w3.org/2001/XMLSchema-instance" xsi:schemaLocation="http://jasperreports.sourceforge.net/jasperreports http://jasperreports.sourceforge.net/xsd/jasperreport.xsd" name="Frames" pageWidth="595" pageHeight="842" columnWidth="555" leftMargin="20" rightMargin="20" topMargin="20" bottomMargin="20" uuid="5ac4213c-a87a-46d0-bfd2-bfff11545590">
<property name="com.jaspersoft.studio.data.defaultdataadapter" value="One Empty Record"/>
<property name="ireport.callouts" value="callouts.1.fg=0,0,0\ncallouts.1.text=sadakar 7/17/18 1\:20 AM\r\n\r\nAppearance section\r\n------------------------------\r\nPosition Type \= Float\r\nStretch Type \= Relative to Tallest Object\r\n\r\nText field section\r\n--------------------------\r\nCheck Streatch with Overflow\r\n\r\nOther references\r\nhttps\://community.jaspersoft.com/blog/tip-detail-overflow-vs-stretch-overflow-jasper-reports-when-use-how-avoid-repetaitonimages-or\ncallouts.1.bounds=50,60,360,250\ncallouts.1.bg=255,255,0\n"/>
<queryString>
<![CDATA[]]>
</queryString>
<background>
<band splitType="Stretch"/>
</background>
<summary>
<band height="30" splitType="Stretch">
<textField isStretchWithOverflow="true">
<reportElement positionType="Float" stretchType="RelativeToTallestObject" x="0" y="0" width="100" height="30" uuid="eb1d8f3e-313a-469f-a4a9-6585d7c3388a"/>
<box>
<topPen lineWidth="1.0" lineStyle="Solid" lineColor="#000000"/>
<leftPen lineWidth="1.0" lineStyle="Solid" lineColor="#000000"/>
<bottomPen lineWidth="1.0" lineStyle="Solid" lineColor="#000000"/>
<rightPen lineWidth="1.0" lineStyle="Solid" lineColor="#000000"/>
</box>
<textFieldExpression><![CDATA["Hi"]]></textFieldExpression>
</textField>
<textField isStretchWithOverflow="true">
<reportElement positionType="Float" stretchType="RelativeToTallestObject" x="100" y="0" width="100" height="30" uuid="8bc5b479-d3d7-4f30-b77a-8d69f2da10e0"/>
<box>
<topPen lineWidth="1.0" lineStyle="Solid" lineColor="#000000"/>
<leftPen lineWidth="1.0" lineStyle="Solid" lineColor="#000000"/>
<bottomPen lineWidth="1.0" lineStyle="Solid" lineColor="#000000"/>
<rightPen lineWidth="1.0" lineStyle="Solid" lineColor="#000000"/>
</box>
<textFieldExpression><![CDATA["Yakuza Solo hopes his bamboo bicycle will make the world aware of his home state of Nagaland."]]></textFieldExpression>
</textField>
</band>
</summary>
</jasperReport>

How is your palette looking in Jaspersoft Studio ?

Are you tired of easily finding the components of palette to design reports in jaspersoft studio?

You can use the combination of "large icons" with "Layout" as "Columns" instead of routine look and feel. As shown in below image, right click on any empty space in the window, let's say in "Basic Elements" section, right click anywhere and select "Use Large Icons" with  the combination of "Layout" as "Columns" and have an easy access to the components when you write some complex reports. !  


Cheers! Small things sometimes saves a bit time. 

- Sadakar Pochampalli 

Composite element example in Jaspersoft Reports

Hi,

Composite element allow to create a new element in the palette starting from one or more basic elements, and reuse them whenever you want in any report.

As shown in below image you can take basic elements like Text Field and Ellipse from palette. Right click on the selection of these two to create composite element and give required details(name, description and an icon with position to keep it on the palette).

(NOTE : Click on image to get the best view of content placed)

(NOTE : Click on image to get the best view of content placed)


Composite element allows below actions(Edit, Export and Import)  in studio.

This way you can create a custom element in palette and use in a project if you have to re-use the code/design. i.e., this will give the flexibility of re-usability of design across reports. kinda a components based templates.

References: https://community.jaspersoft.com/wiki/composite-element

- Sadakar Pochampalli


JRXML:(Supports in 6.4.2 professional or later).
<?xml version="1.0" encoding="UTF-8"?>
<!-- Created with Jaspersoft Studio version 6.4.2.final using JasperReports Library version 6.4.1  -->
<jasperReport xmlns="http://jasperreports.sourceforge.net/jasperreports" xmlns:xsi="http://www.w3.org/2001/XMLSchema-instance" xsi:schemaLocation="http://jasperreports.sourceforge.net/jasperreports http://jasperreports.sourceforge.net/xsd/jasperreport.xsd" name="CompositeElementExample" pageWidth="595" pageHeight="842" columnWidth="555" leftMargin="20" rightMargin="20" topMargin="20" bottomMargin="20" uuid="ab08f6fe-e37c-42b7-8721-c46a41536ae3">
<property name="com.jaspersoft.studio.data.defaultdataadapter" value="One Empty Record"/>
<queryString>
<![CDATA[]]>
</queryString>
<background>
<band splitType="Stretch"/>
</background>
<title>
<band height="133" splitType="Stretch">
<textField>
<reportElement x="138" y="40" width="100" height="30" uuid="0035655a-100c-4dac-a8b8-a91e6a916b0d"/>
<textFieldExpression><![CDATA["Text Field"]]></textFieldExpression>
</textField>
<ellipse>
<reportElement x="240" y="10" width="100" height="79" uuid="3207973b-e49e-43cc-9611-6ed03ce5b3cd"/>
</ellipse>
</band>
</title>
<pageHeader>
<band height="35" splitType="Stretch"/>
</pageHeader>
<columnHeader>
<band height="61" splitType="Stretch"/>
</columnHeader>
<detail>
<band height="125" splitType="Stretch"/>
</detail>
<columnFooter>
<band height="45" splitType="Stretch"/>
</columnFooter>
<pageFooter>
<band height="54" splitType="Stretch"/>
</pageFooter>
<summary>
<band height="42" splitType="Stretch"/>
</summary>
</jasperReport>


Tip: HTML-5 bar chart 3D view in jaspersoft studio reports

Hi,

Set below advanced properties to get the 3D look and feel of HTML-5 bar chart in jaspersoft studio reports.

In chart advanced settings navigate to chart --> options3d and set the values for the properties as shown in below.


Sample output:
References: 
1) https://community.jaspersoft.com/wiki/advanced-chart-formatting
2) https://www.highcharts.com/demo/3d-column-interactive


JRXML ( Supports : 7.2 professional or later)
<?xml version="1.0" encoding="UTF-8"?>
<!-- Created with Jaspersoft Studio version 7.2.0.final using JasperReports Library version 6.6.0  -->
<jasperReport xmlns="http://jasperreports.sourceforge.net/jasperreports" xmlns:xsi="http://www.w3.org/2001/XMLSchema-instance" xsi:schemaLocation="http://jasperreports.sourceforge.net/jasperreports http://jasperreports.sourceforge.net/xsd/jasperreport.xsd" name="1 Bar Chart" pageWidth="900" pageHeight="842" columnWidth="860" leftMargin="20" rightMargin="20" topMargin="20" bottomMargin="20" uuid="e3eaa82e-0ebf-4040-9ffa-69e6d8f80d09">
<property name="com.jaspersoft.studio.data.defaultdataadapter" value="foodmart"/>
<property name="com.jaspersoft.studio.data.sql.tables" value=""/>
<property name="ireport.jasperserver.url" value="http://localhost:8080/jasperserver-pro/"/>
<property name="ireport.jasperserver.user" value="superuser"/>
<property name="ireport.jasperserver.report.resource" value="/public/HTML_5_Advanced_2018_19/Bar/1_Bar_Chart_options3d_files/main_jrxml"/>
<property name="ireport.jasperserver.reportUnit" value="/public/HTML_5_Advanced_2018_19/Bar/1_Bar_Chart_options3d"/>
<queryString>
<![CDATA[SELECT
    p.brand_name,
    SUM(sf7.store_sales) store_sales
FROM product p
INNER JOIN sales_fact_1997 sf7
    ON p.product_id=sf7.product_id
GROUP BY p.brand_name
ORDER BY store_sales DESC ,
  p.brand_name LIMIT 10]]>
</queryString>
<field name="brand_name" class="java.lang.String">
<property name="com.jaspersoft.studio.field.label" value="brand_name"/>
<property name="com.jaspersoft.studio.field.tree.path" value="product"/>
</field>
<field name="store_sales" class="java.math.BigDecimal">
<property name="com.jaspersoft.studio.field.label" value="store_sales"/>
</field>
<background>
<band splitType="Stretch"/>
</background>
<summary>
<band height="300" splitType="Stretch">
<componentElement>
<reportElement x="0" y="30" width="680" height="270" uuid="214b17e1-736c-4964-904a-3eb532865e08"/>
<hc:chart xmlns:hc="http://jaspersoft.com/highcharts" xsi:schemaLocation="http://jaspersoft.com/highcharts http://jaspersoft.com/schema/highcharts.xsd" type="Column">
<hc:chartSetting name="default">
<hc:chartProperty name="title.text" value=""/>
<hc:chartProperty name="credits.enabled" value="false"/>
<hc:chartProperty name="credits.href" value=""/>
<hc:chartProperty name="credits.text" value=""/>
<hc:chartProperty name="yAxis.title.text" value=""/>
<hc:chartProperty name="chart.zoomType" value="xy"/>
<hc:chartProperty name="chart.options3d.enabled_customSimpleMode" value="true"/>
<hc:chartProperty name="chart.options3d.enabled">
<hc:propertyExpression><![CDATA[true]]></hc:propertyExpression>
</hc:chartProperty>
<hc:chartProperty name="chart.options3d.alpha_customSimpleMode" value="true"/>
<hc:chartProperty name="chart.options3d.alpha">
<hc:propertyExpression><![CDATA[15]]></hc:propertyExpression>
</hc:chartProperty>
<hc:chartProperty name="chart.options3d.beta_customSimpleMode" value="true"/>
<hc:chartProperty name="chart.options3d.beta">
<hc:propertyExpression><![CDATA[15]]></hc:propertyExpression>
</hc:chartProperty>
<hc:chartProperty name="chart.options3d.depth_customSimpleMode" value="true"/>
<hc:chartProperty name="chart.options3d.depth">
<hc:propertyExpression><![CDATA[50]]></hc:propertyExpression>
</hc:chartProperty>
<hc:chartProperty name="chart.options3d.viewDistance_customSimpleMode" value="true"/>
<hc:chartProperty name="chart.options3d.viewDistance">
<hc:propertyExpression><![CDATA[25]]></hc:propertyExpression>
</hc:chartProperty>
</hc:chartSetting>
<multiAxisData>
<multiAxisDataset/>
<dataAxis axis="Rows">
<axisLevel name="Level1">
<labelExpression><![CDATA["Level Label expression"]]></labelExpression>
<axisLevelBucket class="java.lang.Comparable">
<bucketExpression><![CDATA[$F{brand_name}]]></bucketExpression>
</axisLevelBucket>
</axisLevel>
</dataAxis>
<dataAxis axis="Columns"/>
<multiAxisMeasure name="Measure1" class="java.lang.Number" calculation="Nothing">
<labelExpression><![CDATA["sales"]]></labelExpression>
<valueExpression><![CDATA[$F{store_sales}]]></valueExpression>
</multiAxisMeasure>
</multiAxisData>
<hc:series name="Measure1"/>
</hc:chart>
</componentElement>
</band>
</summary>
</jasperReport>

Tip : HTML-5 pie chart as HTML-5 3D pie chart in jaspersoft studio reports - advanced properties

Hi,

Convert a basic HTML-5 pie chart to have HTML-5 3D look and feel by setting up below advanced properties for the graph.


API properties:

 chart: {
        type: 'pie',
        options3d: {
            enabled: true,
            alpha: 45,
            beta: 0
        }


plotOptions: {
        pie: {
            allowPointSelect: true,
            cursor: 'pointer',
            depth: 35,
            dataLabels: {
                enabled: true,
                format: '{point.name}'
            }
        }


How these are converted to pie chart advanced properties:


References: 
https://www.highcharts.com/demo/3d-pie
https://jsfiddle.net/gh/get/library/pure/highcharts/highcharts/tree/master/samples/highcharts/demo/3d-pie/

JRXML (Supports in 7.2 pro or later)
<?xml version="1.0" encoding="UTF-8"?>
<!-- Created with Jaspersoft Studio version 7.2.0.final using JasperReports Library version 6.6.0  -->
<jasperReport xmlns="http://jasperreports.sourceforge.net/jasperreports" xmlns:xsi="http://www.w3.org/2001/XMLSchema-instance" xsi:schemaLocation="http://jasperreports.sourceforge.net/jasperreports http://jasperreports.sourceforge.net/xsd/jasperreport.xsd" name="pieChart" pageWidth="595" pageHeight="842" columnWidth="555" leftMargin="20" rightMargin="20" topMargin="20" bottomMargin="20" uuid="9c2bb08a-3188-44e0-b308-9db8c18be066">
<property name="com.jaspersoft.studio.data.defaultdataadapter" value="foodmart"/>
<property name="com.jaspersoft.studio.data.sql.tables" value=""/>
<property name="com.jaspersoft.studio.data.sql.SQLQueryDesigner.sash.w1" value="306"/>
<property name="com.jaspersoft.studio.data.sql.SQLQueryDesigner.sash.w2" value="687"/>
<property name="com.jaspersoft.studio.property.dataset.dialog.DatasetDialog.sash.w1" value="361"/>
<property name="com.jaspersoft.studio.property.dataset.dialog.DatasetDialog.sash.w2" value="625"/>
<property name="ireport.jasperserver.url" value="http://localhost:8080/jasperserver-pro/"/>
<property name="ireport.jasperserver.user" value="superuser"/>
<property name="ireport.jasperserver.report.resource" value="/public/HTML_5_Advanced_2018_19/Pie/9_Pie_Chart_As_3D_Pie_files/main_jrxml"/>
<property name="ireport.jasperserver.reportUnit" value="/public/HTML_5_Advanced_2018_19/Pie/9_Pie_Chart_As_3D_Pie"/>
<queryString>
<![CDATA[SELECT
occupation,
SUM(num_cars_owned) cars
FROM customer
GROUP BY occupation
ORDER BY occupation]]>
</queryString>
<field name="occupation" class="java.lang.String">
<property name="com.jaspersoft.studio.field.label" value="occupation"/>
<property name="com.jaspersoft.studio.field.tree.path" value="customer"/>
</field>
<field name="cars" class="java.lang.Long">
<property name="com.jaspersoft.studio.field.label" value="cars"/>
</field>
<background>
<band splitType="Stretch"/>
</background>
<summary>
<band height="344" splitType="Stretch">
<componentElement>
<reportElement x="0" y="0" width="555" height="344" uuid="bece7be7-9c73-45cb-89f1-ca2552ecdf19"/>
<hc:chart xmlns:hc="http://jaspersoft.com/highcharts" xsi:schemaLocation="http://jaspersoft.com/highcharts http://jaspersoft.com/schema/highcharts.xsd" type="Pie">
<hc:chartSetting name="default">
<hc:chartProperty name="title.text" value=""/>
<hc:chartProperty name="credits.enabled" value="false"/>
<hc:chartProperty name="credits.href" value=""/>
<hc:chartProperty name="credits.text" value=""/>
<hc:chartProperty name="yAxis.title.text" value=""/>
<hc:chartProperty name="chart.zoomType" value="xy"/>
<hc:chartProperty name="com.jaspersoft.studio.highcharts.dataconfiguration.simple" value="true"/>
<hc:chartProperty name="plotOptions.pie.showInLegend" value="true"/>
<hc:chartProperty name="chart.options3d.alpha_customSimpleMode" value="true"/>
<hc:chartProperty name="chart.options3d.alpha">
<hc:propertyExpression><![CDATA[45]]></hc:propertyExpression>
</hc:chartProperty>
<hc:chartProperty name="chart.options3d.enabled_customSimpleMode" value="true"/>
<hc:chartProperty name="chart.options3d.enabled">
<hc:propertyExpression><![CDATA[true]]></hc:propertyExpression>
</hc:chartProperty>
<hc:chartProperty name="plotOptions.pie.allowPointSelect_customSimpleMode" value="true"/>
<hc:chartProperty name="plotOptions.pie.allowPointSelect">
<hc:propertyExpression><![CDATA[true]]></hc:propertyExpression>
</hc:chartProperty>
<hc:chartProperty name="plotOptions.pie.cursor" value="pointer"/>
<hc:chartProperty name="plotOptions.pie.depth_customSimpleMode" value="true"/>
<hc:chartProperty name="plotOptions.pie.depth">
<hc:propertyExpression><![CDATA[35]]></hc:propertyExpression>
</hc:chartProperty>
<hc:chartProperty name="plotOptions.pie.dataLabels.format" value="{point.name}"/>
</hc:chartSetting>
<multiAxisData>
<multiAxisDataset/>
<dataAxis axis="Rows">
<axisLevel name="Level1">
<labelExpression><![CDATA["Level Label expression"]]></labelExpression>
<axisLevelBucket class="java.lang.Comparable">
<bucketExpression><![CDATA[$F{occupation}]]></bucketExpression>
</axisLevelBucket>
</axisLevel>
</dataAxis>
<multiAxisMeasure name="Measure1" class="java.lang.Number" calculation="Nothing">
<labelExpression><![CDATA["Cars"]]></labelExpression>
<valueExpression><![CDATA[$F{cars}]]></valueExpression>
</multiAxisMeasure>
</multiAxisData>
</hc:chart>
</componentElement>
</band>
</summary>
</jasperReport>

Tip : How to set background image for column(bar) chart in HTML-5 charts in jaspersoft studio reports ?

Hi, 

Set below property in chart Advanced properties to get the back-ground image for a column chart. 


<hc:chartProperty name="chart.plotBackgroundImage">
<hc:propertyExpression><![CDATA["https://www.tibco.com/blog/wp-content/uploads/2016/03/rsz_bigstock-global-network-mesh-social-co-85856486.jpg"]]></hc:propertyExpression>
</hc:chartProperty>

JRXML(works from 7.2 pro or later)

<?xml version="1.0" encoding="UTF-8"?>
<!-- Created with Jaspersoft Studio version 7.2.0.final using JasperReports Library version 6.6.0  -->
<jasperReport xmlns="http://jasperreports.sourceforge.net/jasperreports" xmlns:xsi="http://www.w3.org/2001/XMLSchema-instance" xsi:schemaLocation="http://jasperreports.sourceforge.net/jasperreports http://jasperreports.sourceforge.net/xsd/jasperreport.xsd" name="1 Bar Chart" pageWidth="900" pageHeight="842" columnWidth="860" leftMargin="20" rightMargin="20" topMargin="20" bottomMargin="20" uuid="e3eaa82e-0ebf-4040-9ffa-69e6d8f80d09">
<property name="com.jaspersoft.studio.data.defaultdataadapter" value="foodmart"/>
<property name="com.jaspersoft.studio.data.sql.tables" value=""/>
<property name="ireport.jasperserver.url" value="http://localhost:8080/jasperserver-pro/"/>
<property name="ireport.jasperserver.user" value="superuser"/>
<property name="ireport.jasperserver.report.resource" value="/public/HTML_5_Advanced_2018_19/Bar/3_Bar_Chart_Background_image_files/main_jrxml"/>
<property name="ireport.jasperserver.reportUnit" value="/public/HTML_5_Advanced_2018_19/Bar/3_Bar_Chart_Background_image"/>
<queryString>
<![CDATA[SELECT
    p.brand_name,
    SUM(sf7.store_sales) store_sales
FROM product p
INNER JOIN sales_fact_1997 sf7
    ON p.product_id=sf7.product_id
GROUP BY p.brand_name
ORDER BY
SUM(sf7.store_sales)
limit 10]]>
</queryString>
<field name="brand_name" class="java.lang.String">
<property name="com.jaspersoft.studio.field.label" value="brand_name"/>
<property name="com.jaspersoft.studio.field.tree.path" value="product"/>
</field>
<field name="store_sales" class="java.math.BigDecimal">
<property name="com.jaspersoft.studio.field.label" value="store_sales"/>
</field>
<background>
<band splitType="Stretch"/>
</background>
<summary>
<band height="416" splitType="Stretch">
<componentElement>
<reportElement x="0" y="30" width="750" height="360" uuid="214b17e1-736c-4964-904a-3eb532865e08">
<property name="com.jaspersoft.studio.unit.height" value="px"/>
</reportElement>
<hc:chart xmlns:hc="http://jaspersoft.com/highcharts" xsi:schemaLocation="http://jaspersoft.com/highcharts http://jaspersoft.com/schema/highcharts.xsd" type="Column">
<hc:chartSetting name="default">
<hc:chartProperty name="title.text" value=""/>
<hc:chartProperty name="credits.enabled" value="false"/>
<hc:chartProperty name="credits.href" value=""/>
<hc:chartProperty name="credits.text" value=""/>
<hc:chartProperty name="yAxis.title.text" value=""/>
<hc:chartProperty name="chart.zoomType" value="xy"/>
<hc:chartProperty name="chart.options3d.enabled_customSimpleMode" value="true"/>
<hc:chartProperty name="chart.options3d.alpha_customSimpleMode" value="true"/>
<hc:chartProperty name="chart.options3d.beta_customSimpleMode" value="true"/>
<hc:chartProperty name="chart.options3d.depth_customSimpleMode" value="true"/>
<hc:chartProperty name="chart.options3d.viewDistance_customSimpleMode" value="true"/>
<hc:chartProperty name="chart.borderWidth_customSimpleMode" value="true"/>
<hc:chartProperty name="chart.borderRadius_customSimpleMode" value="true"/>
<hc:chartProperty name="chart.plotBackgroundImage">
<hc:propertyExpression><![CDATA["https://www.tibco.com/blog/wp-content/uploads/2016/03/rsz_bigstock-global-network-mesh-social-co-85856486.jpg"]]></hc:propertyExpression>
</hc:chartProperty>
</hc:chartSetting>
<multiAxisData>
<multiAxisDataset/>
<dataAxis axis="Rows">
<axisLevel name="Level1">
<labelExpression><![CDATA["Level Label expression"]]></labelExpression>
<axisLevelBucket order="None" class="java.lang.Comparable">
<bucketExpression><![CDATA[$F{brand_name}]]></bucketExpression>
</axisLevelBucket>
</axisLevel>
</dataAxis>
<dataAxis axis="Columns"/>
<multiAxisMeasure name="Measure1" class="java.lang.Number" calculation="Nothing">
<labelExpression><![CDATA["sales"]]></labelExpression>
<valueExpression><![CDATA[$F{store_sales}]]></valueExpression>
</multiAxisMeasure>
</multiAxisData>
<hc:series name="Measure1"/>
</hc:chart>
</componentElement>
</band>
</summary>
</jasperReport>

HTML5(high charts) Scatter plot visualization demo in jasper reports (7.1.1 pro)

Sample output


SQL and data preparation 

create table scatterplot_jasper_highcarts(gender_series text, measure1 integer , measure2 float)

select * from scatterplot_jasper_highcarts

INSERT INTO scatterplot_jasper_highcarts (gender_series,measure1,measure2) VALUES
('f',35000.00,350.53)
,('m',35000.00,256.03)
,('f',45000.00,315.36)
,('m',45000.00,162.11)
,('f',50000.00,260.12)
,('f',50000.00,220.54)
,('f',50000.00,274.39)
,('f',50000.00,189.90)
,('m',50000.00,216.15)
,('m',50000.00,218.36)


INSERT INTO scatterplot_jasper_highcarts (gender_series,measure1,measure2) VALUES
('m',50000.00,214.47)
,('m',50000.00,172.80)
,('f',50000.00,183.29)
,('m',55000.00,323.93)
,('f',60000.00,219.95)
,('f',60000.00,204.66)
,('f',60000.00,208.88)
,('f',60000.00,216.76)
,('m',60000.00,239.10)
,('m',65000.00,208.76)
;


JRXML ( developed on 7.1.1 professional) 

<?xml version="1.0" encoding="UTF-8"?>
<!-- Created with Jaspersoft Studio version 7.2.0.final using JasperReports Library version 6.6.0  -->
<jasperReport xmlns="http://jasperreports.sourceforge.net/jasperreports" xmlns:xsi="http://www.w3.org/2001/XMLSchema-instance" xsi:schemaLocation="http://jasperreports.sourceforge.net/jasperreports http://jasperreports.sourceforge.net/xsd/jasperreport.xsd" name="Benchmarking Avg. Deductible is &lt;450k" pageWidth="620" pageHeight="440" whenNoDataType="AllSectionsNoDetail" columnWidth="620" leftMargin="0" rightMargin="0" topMargin="0" bottomMargin="0" isIgnorePagination="true" uuid="ea6e0229-23a6-43f3-bec9-122a187df2a5">
<property name="com.jaspersoft.studio.data.defaultdataadapter" value="explore - postgres"/>
<property name="ireport.jasperserver.url" value="http://localhost:8080/jasperserver-pro/"/>
<property name="ireport.jasperserver.user" value="superuser"/>
<property name="ireport.jasperserver.reportUnit" value="/Explore/Plot_All_data_points_explore"/>
<property name="com.jaspersoft.studio.data.sql.tables" value=""/>
<property name="com.jaspersoft.studio.report.unit.description" value="IllustrativeRenewalPackage"/>
<property name="com.jaspersoft.studio.unit." value="pixel"/>
<property name="com.jaspersoft.jasperreports.highcharts.interactive" value="false"/>
<property name="ireport.jasperserver.report.resource" value="/Explore/Plot_All_data_points_explore_files/main_jrxml"/>
<queryString>
<![CDATA[select * from scatterplot_jasper_highcarts]]>
</queryString>
<field name="gender_series" class="java.lang.String">
<property name="com.jaspersoft.studio.field.label" value="gender_series"/>
<property name="com.jaspersoft.studio.field.tree.path" value="scatterplot_jasper_highcarts"/>
</field>
<field name="measure1" class="java.lang.Integer">
<property name="com.jaspersoft.studio.field.label" value="measure1"/>
<property name="com.jaspersoft.studio.field.tree.path" value="scatterplot_jasper_highcarts"/>
</field>
<field name="measure2" class="java.lang.Double">
<property name="com.jaspersoft.studio.field.label" value="measure2"/>
<property name="com.jaspersoft.studio.field.tree.path" value="scatterplot_jasper_highcarts"/>
</field>
<title>
<band height="440" splitType="Stretch">
<property name="com.jaspersoft.studio.unit.height" value="px"/>
<componentElement>
<reportElement x="0" y="0" width="620" height="440" uuid="61f9bb70-9738-4a8e-bb56-2be60b25ee72"/>
<hc:chart xmlns:hc="http://jaspersoft.com/highcharts" xsi:schemaLocation="http://jaspersoft.com/highcharts http://jaspersoft.com/schema/highcharts.xsd" type="Scatter" evaluationTime="Report">
<hc:chartSetting name="default">
<hc:chartProperty name="credits.enabled" value="false"/>
<hc:chartProperty name="credits.href" value=""/>
<hc:chartProperty name="credits.text" value=""/>
<hc:chartProperty name="chart.zoomType" value="xy"/>
<hc:chartProperty name="legend.enabled_customSimpleMode" value="true"/>
<hc:chartProperty name="legend.enabled">
<hc:propertyExpression><![CDATA[true]]></hc:propertyExpression>
</hc:chartProperty>
<hc:chartProperty name="plotOptions.series.marker.radius">
<hc:propertyExpression><![CDATA[6]]></hc:propertyExpression>
</hc:chartProperty>
<hc:chartProperty name="title.text" value="Scatter plot demo"/>
</hc:chartSetting>
<multiAxisData>
<multiAxisDataset/>
<dataAxis axis="Rows">
<axisLevel name="Level1">
<labelExpression><![CDATA["Level Label expression"]]></labelExpression>
<axisLevelBucket class="java.lang.Comparable">
<bucketExpression><![CDATA[$V{REPORT_COUNT}]]></bucketExpression>
</axisLevelBucket>
</axisLevel>
</dataAxis>
<dataAxis axis="Columns">
<axisLevel name="&quot;gender&quot;">
<labelExpression><![CDATA[]]></labelExpression>
<axisLevelBucket class="java.lang.Comparable">
<bucketExpression><![CDATA[$F{gender_series}]]></bucketExpression>
<labelExpression><![CDATA["gender"]]></labelExpression>
</axisLevelBucket>
</axisLevel>
</dataAxis>
<multiAxisMeasure name="measure1" class="java.lang.Number" calculation="Nothing">
<labelExpression><![CDATA["measure1"]]></labelExpression>
<valueExpression><![CDATA[$F{measure1}]]></valueExpression>
</multiAxisMeasure>
<multiAxisMeasure name="measure2" class="java.lang.Number" calculation="Nothing">
<labelExpression><![CDATA["measure2"]]></labelExpression>
<valueExpression><![CDATA[$F{measure2}]]></valueExpression>
</multiAxisMeasure>
</multiAxisData>
<hc:series name="measure1"/>
<hc:series name="measure2"/>
</hc:chart>
</componentElement>
</band>
</title>
</jasperReport>

Tip : How to increase or decrease HTML5 scatter plot chart bubble size in jasper reports

Viewing all 261 articles
Browse latest View live