Quantcast
Channel: Pochampalli IT Labs
Viewing all 261 articles
Browse latest View live

Tip : How to call an image inside HTML component in Jasper Studio Reports 6.2 or later

$
0
0
Hi,

In this post you can learn, how to call an image inside HTML component using HTML script and  how to apply style to it.

With in the Studio and Operating System Environment

Lets assume, you have an image on your desktop say : tibco.png and the path for the image is  C:\Users\sadakar\Desktop\tibco.png

If you want to use the same image to get in JRXML inside HTML component, convert the path of the image as file:///C:/Users/sadakar/Desktop/tibco.png


Drag and drop html component to be of your choice of band, for instance drag HTML component to summary band and double click on it to open its "Expression Editor" and write below HTML code along with styles.

"<p style='background-color:yellow;font-family:verdana;font-size:50px;'>Hi, I am through HTML CODE using HTML Component</p>"+"<br><br>"+
"<img src='file:///C:/Users/sadakar/Desktop/tibco.png' alt='Japser Architecture' height='1000' width='1800'>"


Sample screenshot of the above code : 


Sample output for the above design


Sample JRXML code: (Copy paste the below code and change image path of your choice - version supported for this example is 6.2 pro or later)

<?xml version="1.0" encoding="UTF-8"?>
<!-- Created with Jaspersoft Studio version 6.2.0.final using JasperReports Library version 6.2.0  -->
<!-- 2016-08-06T16:53:41 -->
<jasperReport xmlns="http://jasperreports.sourceforge.net/jasperreports" xmlns:xsi="http://www.w3.org/2001/XMLSchema-instance" xsi:schemaLocation="http://jasperreports.sourceforge.net/jasperreports http://jasperreports.sourceforge.net/xsd/jasperreport.xsd" name="Blank_A4_1" pageWidth="595" pageHeight="842" columnWidth="555" leftMargin="20" rightMargin="20" topMargin="20" bottomMargin="20" uuid="de083992-95ea-48ad-983f-f63b1b7885ab">
<property name="com.jaspersoft.studio.data.defaultdataadapter" value="One Empty Record"/>
<queryString>
<![CDATA[]]>
</queryString>
<title>
<band height="79" splitType="Stretch"/>
</title>
<summary>
<band height="381" splitType="Stretch">
<componentElement>
<reportElement x="0" y="0" width="555" height="381" uuid="c557a700-606d-4893-af98-ca8df921bef9"/>
<hc:html xmlns:hc="http://jasperreports.sourceforge.net/htmlcomponent" xsi:schemaLocation="http://jasperreports.sourceforge.net/htmlcomponent http://jasperreports.sourceforge.net/xsd/htmlcomponent.xsd" scaleType="RetainShape" horizontalAlign="Left" verticalAlign="Middle">
<hc:htmlContentExpression><![CDATA["<p style='background-color:yellow;font-family:verdana;font-size:50px;'>Hi, I am through HTML CODE using HTML Component</p>"+"<br><br>"+
"<img src='file:///C:/Users/sadakar/Desktop/tibco.png' alt='Japser Architecture' height='1000' width='1800'>"]]></hc:htmlContentExpression>
</hc:html>
</componentElement>
</band>
</summary>

</jasperReport>


NOTE: This example is specific for absolute path image with in the studio and operating system environment. It can not be deployed to Japser Server unless you have HTML component jar file installed in lib folder of tomcat.

Usually we go for this kind of implementation to represent web clocks showing different time zones on the report.

I hope it helps some one in community.

Cheers.!
Sadakar Pochampalli


Examples of all HTML-5 graphs in TIBCO Japsersoft Design Studio 6.2 Professional

$
0
0
Hi,

Below are the full stack examples of HTML-5 graphs as of 6.2 Professional Studio.

Hit the download link in the bottom and explore how to configure categories , series  and values.


note that only basic configurations are done for examples.

Download:Click Me

Sample outputs of the above examples :

1) Bubble Chart Example 

2) Time Series Area Spline Chart


3) Spider Area Chart


4) Stacked Column with Line


5) Multi Axis Spline Chart


NOTE: Zip file is password protected - write to me for password. ( download )


Cheers.!
Sadakar Pochampalli

Examples of all fusion graphs in TIBCO Jaspersoft Design Studio 6.2 Professional

$
0
0
Hi,

Below are the full stack examples of all fusion graphs as of 6.2 Professional Studio.

Hit the download link in the bottom and explore how to configure categories , series  and values.


note that only basic configurations are done.

Download: Click Me

Sample outputs of the above examples :

1) 3d pie chart

2) Line chart with 2 series 

3) Stacked Column(vertical) bar chart

4) Fusion 3D Bar Chart 

NOTE: Zip file is password protected - write to me for password. ( download )


Cheers.!
Sadakar Pochampalli

Tip : Conditional Image display in Jasper Reports 6.2 or later

$
0
0
Hi,

In this post you will see how to write conditional expression to compare two fields and based on return value display images.
Lets assume you have number1 and number2 fields of BigDecimal types. Write below expression in image path expression editor itself.


($F{NUMBER1}.intValue()!=0 && $F{NUMBER2}.intValue()!=0) &&
($F{NUMBER1}.intValue()==$F{NUMBER2}.intValue() )

? "C:/Users/sadakar.p/Desktop/image.jpg": "C:/Users/sadakar.p/Desktop/image2.jpg"


True case : 
SELECT 1234.45 as number1, 1234.45 as number2 FROM dual
False case :
SELECT 1234.45 as number1, 567.32 as number2 FROM dual

NOTE : 
1) Do not give empty quotes for the false section(true section) any where in the expression. If you give, you may stop with HTML 500 error message.
2) Make sure the image paths are given with "repo:<serverpath of the image>" when report is published.
3) This example is developed using 6.2 Pro studio and oracle queries are used for demonstration.

JRXML Code : 
<?xml version="1.0" encoding="UTF-8"?>
<!-- Created with Jaspersoft Studio version 6.2.0.final using JasperReports Library version 6.2.0  -->
<!-- 2016-08-22T11:43:19 -->
<jasperReport xmlns="http://jasperreports.sourceforge.net/jasperreports" xmlns:xsi="http://www.w3.org/2001/XMLSchema-instance" xsi:schemaLocation="http://jasperreports.sourceforge.net/jasperreports http://jasperreports.sourceforge.net/xsd/jasperreport.xsd" name="Blank_A4_1" pageWidth="595" pageHeight="842" columnWidth="555" leftMargin="20" rightMargin="20" topMargin="20" bottomMargin="20" uuid="aed847f7-ff38-4b72-9673-2ffa54e62469">
<property name="com.jaspersoft.studio.data.defaultdataadapter" value="ppmguru"/>
<property name="com.jaspersoft.studio.data.sql.tables" value=""/>
<queryString>
<![CDATA[SELECT 1234.45 as number1, 1234.45 as number2 FROM dual]]>
</queryString>
<field name="NUMBER1" class="java.math.BigDecimal"/>
<field name="NUMBER2" class="java.math.BigDecimal"/>
<background>
<band splitType="Stretch"/>
</background>
<summary>
<band height="138" splitType="Stretch">
<image>
<reportElement x="80" y="0" width="235" height="138" uuid="fd567e43-fc8b-45fb-bbee-515dd7cb7ff5"/>
<imageExpression><![CDATA[($F{NUMBER1}.intValue()!=0 && $F{NUMBER2}.intValue()!=0) &&
($F{NUMBER1}.intValue()==$F{NUMBER2}.intValue() )

? "C:/Users/sadakar.p/Desktop/image.jpg": "C:/Users/sadakar.p/Desktop/image2.jpg"]]></imageExpression>
</image>
</band>
</summary>

</jasperReport>


Cheers.!
Sadakar Pochampalli 

Whats new in 6.3 Jasper (Server and Studio) ? from release notes

$
0
0
Hi,
In this post you will see what is new in Jaspersoft 6.3 new release (enterprise and community)

JasperReports Server 6.3.0 includes these improvements:

* Dashboards - New enhancements include:
  - Dashboard and dashlet exporting.
  - Text and image dashlets now support hyperlinks.
  - More formatting options for dashboards and dashlets.
  - New time and date wildcards for dashlets.
  - Auto-complete for parameters and time and date wildcards.
  - Image dashlets have a Browse button for the respository.

* Scheduler - New enhancements include:
  - Support for scheduling Dashboard exports.
  - Support for SFTP with SSH key authentication as a transfer
    protocol.
  - Automatic validation of the path to the repository output
    folder when clicking Save.
  - Support for changing the default output folder by editing a
    configuration file.
 
* Data Connectivity - We continue to improve and refine data 
  access in JasperReports Server. This release adds:
  - New support for Microsoft SQL Azure.
  - New driver for Spark.
  - New Progress driver for Cassandra.
  - New JDBC driver for MongoDB.
  - Updated MongoDB Connector.
  - New Progress driver for Impala.
  - Updated JDBC driver for MariaDB.

* Jaspersoft Studio - New enhancements include:
  - Support for font sets, which let you group font extensions
    in supersets that can include several languages or character
sets and control which languages are used for each font
in the set.
  - Import/export for configuration resources, which lets you
    migrate global configurations, such as global data adapters,
composite elements, and Jaspersoft Studio preferences
between different instances of Jaspersoft Studio.
  - Improved interface for editing properties in HTML5 charts.

* Performance Improvements - JasperReports Server is faster and
  uses less memory when working with high-cardinality data in Ad
  Hoc views or reports based on Ad Hoc views.

* Security Improvements - In our on-going effort to improve the
  security of your data, JasperReports Server implements a new
  Cross-Site Request Forgery (CSRF) protection mechanism that is
  more effective and less intrusive. For more information, see
  the Security Guide.

Read full notes here : Download

MySQL workbench - table data import and export procedure

$
0
0
This is a redistribution of import and export features of MySQL workbench.


6.5.1 Table Data Export and Import Wizard


https://dev.mysql.com/doc/workbench/en/wb-admin-export-import-table.html


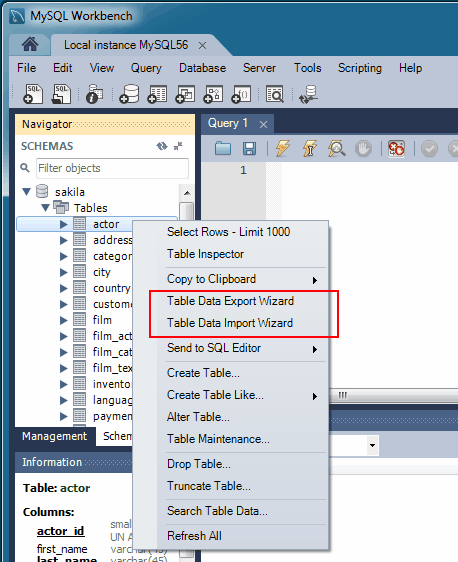
he wizard is accessible from the object browser's context menu by right-clicking on a table and choose either Table Data Export Wizard orTable Data Import Wizard.
Figure 6.14 Table Data Wizards: Open
Table Data Wizards: Open

Table Data Export Wizard

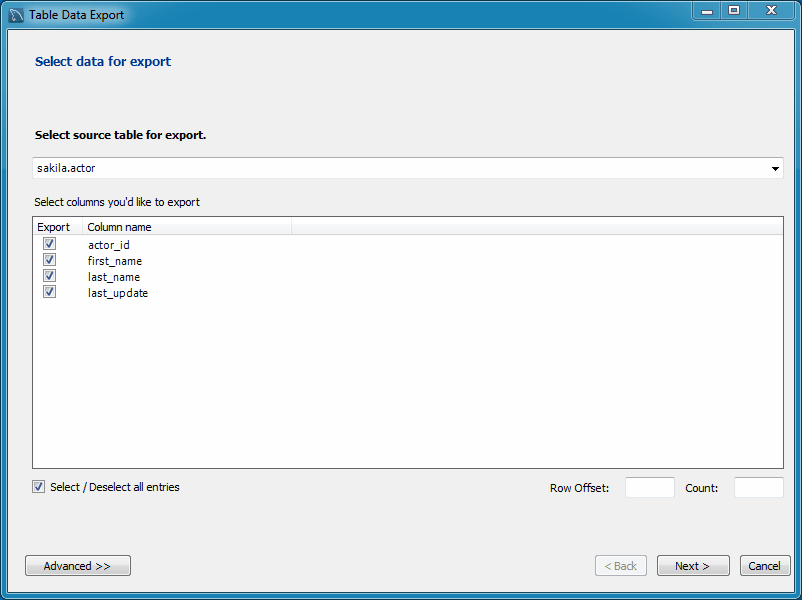
Export table data to either a JSON or CSV file. The following example exports the sakila.actor table to a CSV file.
Figure 6.15 Table Data Export: Source
Table Data Export: Source

Figure 6.16 Table Data Export: CSV Configuration
Table Data Export: Configuration

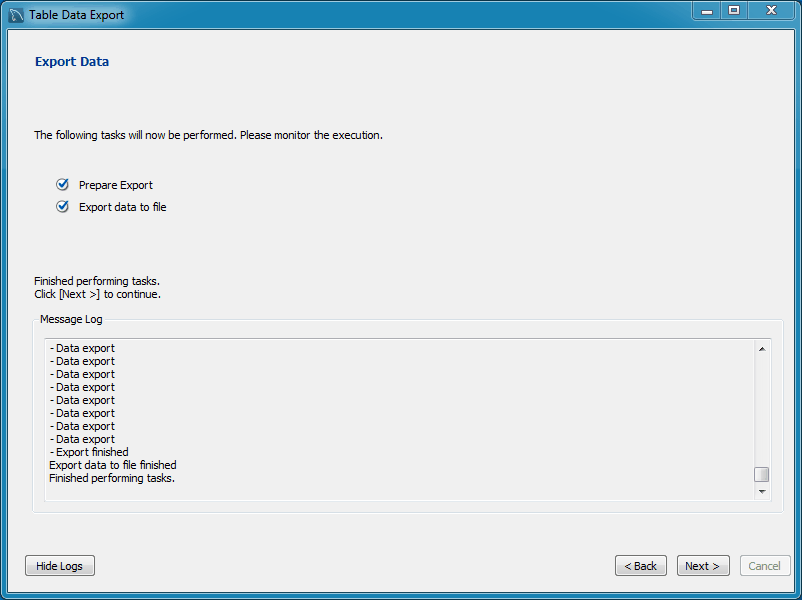
Figure 6.17 Table Data Export: Results
Table Data Export: Results

Table Data Import Wizard

Import table data from either a JSON or CSV file. The following example imports the sakila.actor table from a CSV file.
Figure 6.18 Table Data Import: CSV Source
Table Data Import: CSV Source

Figure 6.19 Table Data Import: Destination Table
Table Data Import: Destination Table

Figure 6.20 Table Data Import: CSV Configuration
Table Data Import: CSV Configuration

Note
The Encoding field should correspond with your CSV file.
Figure 6.21 Table Data Import: Results
Table Data Import: Results

TIBCO Jaspersoft Online demo server (https://mobiledemo.jaspersoft.com/jasperserver-pro/)

$
0
0

Are you a community customer ?
Is your 30-day trail license expired for studio and server ?
Do you want to learn or explore TIBCO jaspersoft Studio Professional features ?
Do you want to learn Enterprise server features (limited in demo as end user) ?
Did you ask your folks to explore self service BI ?
Did you ask your folks to explore self service Dashboards ?

Here you go with Online demo server. You can evaluate TIBCO jasperserver as an end user.

Copy paste or click on below URL
https://mobiledemo.jaspersoft.com/jasperserver-pro/

UserName/Password : joeuser/joeuser


Exploring Self Service BI with Ad-Hoc Views 
Sample Example : Sales Trend By State 

Connecting to this demo server in Studio : 

Exploring out of the examples : 
Viewing the same in server


This way, a new customer or migrating customer or a community folk who wants to explore jasper can dig the enterprise features.

As this server is accessible only with enduser permissions, if you want to explore security side you can refer to the documentation at http://community.jaspersoft.com/documentation?version=33331


- Sadakar Pochampalli 

JFree Statcked Bar Chart Example in Jasper Design Studio

$
0
0
This is a quick re-visit of JFree Stacked Bar chart in Jasper.

Query Format : 
select * from 
(
(
SELECT 
'Store Sales' as Sales, 
date(t.the_date) as date,
SUM(sf7.Store_sales) as SalesFact
FROM sales_fact_1997 sf7  JOIN time_by_day t 
ON sf7.time_id=t.time_id GROUP BY Sales,the_date ORDER BY date
limit 25
)

UNION
(
SELECT 
'Unit Sales' as Sales,
date(t.the_date) as date,
SUM(sf7.unit_sales) as SalesFact  
FROM sales_fact_1997 sf7  JOIN time_by_day t 
ON sf7.time_id=t.time_id GROUP BY Sales,the_date ORDER BY date
limit 25
)
) a ORDER BY a.date

Query Output:
Sales          date          salesfact

"Unit Sales";"2012-01-01";348.0000
"Store Sales";"2012-01-01";706.3400
"Unit Sales";"2012-01-02";635.0000
"Store Sales";"2012-01-02";1304.5300
"Store Sales";"2012-01-03";1294.1200
"Unit Sales";"2012-01-03";589.0000
"Unit Sales";"2012-01-04";20.0000
"Store Sales";"2012-01-04";42.8700
"Store Sales";"2012-01-05";1987.1900
"Unit Sales";"2012-01-05";966.0000


Chart Design : 

Final Output:


JRXML Code : 

Jasper Design Studio Version : Professional 6.3 (If you are using CE studio code may not work)

<?xml version="1.0" encoding="UTF-8"?>
<!-- Created with Jaspersoft Studio version 6.3.0.final using JasperReports Library version 6.3.0  -->
<!-- 2017-03-30T02:48:52 -->
<jasperReport xmlns="http://jasperreports.sourceforge.net/jasperreports" xmlns:xsi="http://www.w3.org/2001/XMLSchema-instance" xsi:schemaLocation="http://jasperreports.sourceforge.net/jasperreports http://jasperreports.sourceforge.net/xsd/jasperreport.xsd" name="BarChartCustomization_XAxisLabels" pageWidth="800" pageHeight="842" columnWidth="760" leftMargin="20" rightMargin="20" topMargin="20" bottomMargin="20" uuid="9e71469d-a266-48ee-9989-9c4913b1190f">
<property name="com.jaspersoft.studio.data.defaultdataadapter" value="foodmart"/>
<property name="com.jaspersoft.studio.data.sql.tables" value=""/>
<property name="com.jaspersoft.studio.unit." value="pixel"/>
<queryString>
<![CDATA[select * from 
(
(
SELECT 
'Store Sales' as Sales, 
date(t.the_date) as date,
SUM(sf7.Store_sales) as SalesFact
FROM sales_fact_1997 sf7  JOIN time_by_day t 
ON sf7.time_id=t.time_id GROUP BY Sales,the_date ORDER BY date
limit 5
)

UNION
(
SELECT 
'Unit Sales' as Sales,
date(t.the_date) as date,
SUM(sf7.unit_sales) as SalesFact  
FROM sales_fact_1997 sf7  JOIN time_by_day t 
ON sf7.time_id=t.time_id GROUP BY Sales,the_date ORDER BY date
limit 5
)
) a ORDER BY a.date]]>
</queryString>
<field name="sales" class="java.lang.String"/>
<field name="date" class="java.sql.Date"/>
<field name="salesfact" class="java.math.BigDecimal"/>
<background>
<band splitType="Stretch"/>
</background>
<summary>
<band height="360" splitType="Stretch">
<stackedBarChart>
<chart evaluationTime="Report">
<reportElement x="0" y="0" width="760" height="360" uuid="f13a44b1-bb8f-49b9-8bd8-4b048ef7e26d"/>
<chartTitle/>
<chartSubtitle/>
<chartLegend/>
</chart>
<categoryDataset>
<categorySeries>
<seriesExpression><![CDATA[$F{sales}]]></seriesExpression>
<categoryExpression><![CDATA[$F{date}.toString()]]></categoryExpression>
<valueExpression><![CDATA[$F{salesfact}]]></valueExpression>
</categorySeries>
</categoryDataset>
<barPlot>
<plot labelRotation="60.0">
<seriesColor seriesOrder="0" color="#BF6B83"/>
<seriesColor seriesOrder="1" color="#129D10"/>
</plot>
<itemLabel/>
<categoryAxisFormat labelRotation="60.0">
<axisFormat/>
</categoryAxisFormat>
<valueAxisFormat>
<axisFormat/>
</valueAxisFormat>
</barPlot>
</stackedBarChart>
</band>
</summary>
</jasperReport>


Jaspersoft Custom Reports Testing Scenarios and Areas

$
0
0

Below are the few common Jasper Reports Testing Scenarios 

General Browser UI
1)Verify the end-user is able to login with the credentials
For example: biuser/biuser
2)Verify report layout as per the mock-up
3)Verify the title of the report – preferable to keep at top middle of the report.
4)Verify the logo of the customer/client – preferable to keep left top of the report. 
5)Verify page number is displayed on the report and is in sequence
6)Verify font, font size of headers and of text consistent throughout the report 
7)Verify tooltip on the report wherever asked to provide
8)Verify report generated date and time.
9)Verify hyperlinks are working fine. 
10)Verify spell check on the report. 
11)Verify numeric values are left aligned and text is right aligned and test padding is applied for them. 
12)Verify pattern (or separator) for numeric values. 
13)Verify report left and right alignments. 
14)Verify NOTE is present wherever asked to provide. 
15)Verify report user guide is added as a PDF or Word as hyperlink to download the file. 
Excel Export 
1)Verify logos are exported to excel.
2)Verify font family and size is same as per the report design. 
3)Verify type of columns for numeric and date fields. Some user may apply formulas or functions in exported excel sheets. 
4)Verify for no empty rows and no empty columns. 
5)Verify exported excel file name should match with the report name. 
Filters testing: 
1)Verify for mandatory filters
2)Verify if the report has cascading filters
3)Verify filters values are in sorted order. 
4)No Data Display message 

Tip: Calculate, first date of the given date , the day of the first date and return 0,1,2,3... for Sun, Mon, Tue,Wed and etc. in Jasper Reports

$
0
0
Calculate, first date of the given date , the day of the first date and return 0,1,2,3... for Sun, Mon, Tue,Wed and etc.


JRXML : Copy paste below code in a JRXML file and preview the report.
(Supports in 6.x CE & Pro Studio)

<?xml version="1.0" encoding="UTF-8"?>
<!-- Created with Jaspersoft Studio version 6.3.1.final using JasperReports Library version 6.3.1  -->
<!-- 2017-06-05T22:43:54 -->
<jasperReport xmlns="http://jasperreports.sourceforge.net/jasperreports" xmlns:xsi="http://www.w3.org/2001/XMLSchema-instance" xsi:schemaLocation="http://jasperreports.sourceforge.net/jasperreports http://jasperreports.sourceforge.net/xsd/jasperreport.xsd" name="demo_calendar" columnCount="7" printOrder="Horizontal" pageWidth="1500" pageHeight="612" orientation="Landscape" whenNoDataType="AllSectionsNoDetail" columnWidth="211" leftMargin="11" rightMargin="11" topMargin="10" bottomMargin="10" uuid="32abf871-39b8-4cc7-b03c-d950a55e2bfb">
 <property name="com.jaspersoft.studio.data.sql.tables" value=""/>
 <property name="com.jaspersoft.studio.data.defaultdataadapter" value="foodmart"/>
 <property name="com.jaspersoft.studio.unit." value="pixel"/>
 <property name="ireport.jasperserver.url" value="http://localhost:8081/jasperserver-pro/"/>
 <property name="ireport.jasperserver.user" value="superuser"/>
 <property name="ireport.jasperserver.report.resource" value="/Work/EarthlySystem/Reports/CalenderReport_files/main_jrxml"/>
 <property name="ireport.jasperserver.reportUnit" value="/Work/EarthlySystem/Reports/CalenderReport"/>
 <style name="Style1" forecolor="#050505">
  <conditionalStyle>
   <conditionExpression><![CDATA[$F{id}.intValue()%7==1]]></conditionExpression>
   <style forecolor="#FA0702"/>
  </conditionalStyle>
 </style>
 <parameter name="Date" class="java.util.Date">
  <defaultValueExpression><![CDATA[new Date()]]></defaultValueExpression>
 </parameter>
 <parameter name="FirstDateOfMonth" class="java.lang.String" isForPrompting="false">
  <defaultValueExpression><![CDATA[new SimpleDateFormat("MM/dd/yyyy").format(java.util.Date.parse(MONTH($P{Date}) + "/1/" + YEAR($P{Date})))]]></defaultValueExpression>
 </parameter>
 <parameter name="FirstDayOfMonth" class="java.lang.String" isForPrompting="false">
  <defaultValueExpression><![CDATA[new SimpleDateFormat("EEE").format(java.util.Date.parse(MONTH($P{Date}) + "/1/" + YEAR($P{Date})))]]></defaultValueExpression>
 </parameter>
 <parameter name="DayReturnValueString" class="java.lang.String" isForPrompting="false">
  <parameterDescription><![CDATA[]]></parameterDescription>
  <defaultValueExpression><![CDATA[$P{FirstDayOfMonth}.equals("Sun") ? "0":
$P{FirstDayOfMonth}.equals("Mon") ? "1" :
$P{FirstDayOfMonth}.equals("Tue") ? "2" :
$P{FirstDayOfMonth}.equals("Wed") ? "3" :
$P{FirstDayOfMonth}.equals("Thu") ? "4" :
$P{FirstDayOfMonth}.equals("Fri") ? "5" :
$P{FirstDayOfMonth}.equals("Sat") ? "6" : "100"]]></defaultValueExpression>
 </parameter>
 <parameter name="DayReturnValueInteger" class="java.lang.Integer" isForPrompting="false">
  <parameterDescription><![CDATA[]]></parameterDescription>
  <defaultValueExpression><![CDATA[Integer.parseInt($P{DayReturnValueString})]]></defaultValueExpression>
 </parameter>
 <queryString>
  <![CDATA[select 1 as One]]>
 </queryString>
 <field name="one" class="java.lang.Integer"/>
 <title>
  <band height="180">
   <textField pattern="MMMM d, yyyy">
    <reportElement x="330" y="0" width="190" height="30" uuid="21293131-3839-43aa-b449-b19867eee2da"/>
    <textElement textAlignment="Left" verticalAlignment="Middle">
     <font size="12" isBold="true"/>
    </textElement>
    <textFieldExpression><![CDATA[$P{Date}]]></textFieldExpression>
   </textField>
   <staticText>
    <reportElement mode="Opaque" x="844" y="30" width="210" height="31" forecolor="#000000" backcolor="#FFFFFF" uuid="81be3ac1-c1c1-4573-86a7-67c891288f1c">
     <property name="com.jaspersoft.studio.unit.y" value="pixel"/>
    </reportElement>
    <box>
     <pen lineWidth="1.0" lineColor="#B1B5B4"/>
    </box>
    <textElement textAlignment="Center" verticalAlignment="Middle">
     <font size="14" isBold="true"/>
    </textElement>
    <text><![CDATA[Thursday]]></text>
   </staticText>
   <staticText>
    <reportElement mode="Opaque" x="1055" y="30" width="210" height="31" forecolor="#000000" backcolor="#FFFFFF" uuid="9442d83e-3726-4db9-8746-04b2fea1449b">
     <property name="com.jaspersoft.studio.unit.y" value="pixel"/>
     <property name="com.jaspersoft.studio.unit.width" value="pixel"/>
    </reportElement>
    <box>
     <pen lineWidth="1.0" lineColor="#B1B5B4"/>
    </box>
    <textElement textAlignment="Center" verticalAlignment="Middle">
     <font size="14" isBold="true"/>
    </textElement>
    <text><![CDATA[Friday]]></text>
   </staticText>
   <staticText>
    <reportElement mode="Opaque" x="1266" y="30" width="210" height="31" forecolor="#000000" backcolor="#FFFFFF" uuid="edc883b5-0e35-4e17-8a45-56efc9dacf6a">
     <property name="com.jaspersoft.studio.unit.y" value="pixel"/>
     <property name="com.jaspersoft.studio.unit.width" value="pixel"/>
    </reportElement>
    <box>
     <pen lineWidth="1.0" lineColor="#B1B5B4"/>
    </box>
    <textElement textAlignment="Center" verticalAlignment="Middle">
     <font size="14" isBold="true"/>
    </textElement>
    <text><![CDATA[Saturday]]></text>
   </staticText>
   <textField>
    <reportElement x="330" y="30" width="190" height="30" uuid="ca304690-d49b-4280-8c75-8fd1451bd59f"/>
    <textElement verticalAlignment="Middle">
     <font size="12" isBold="true"/>
    </textElement>
    <textFieldExpression><![CDATA[new SimpleDateFormat("MM/dd/yyyy").format(java.util.Date.parse(MONTH(NOW( )) + "/1/" + YEAR(NOW())))]]></textFieldExpression>
   </textField>
   <textField>
    <reportElement x="330" y="61" width="190" height="30" uuid="5d27b8b2-76cf-4eed-8486-6644f5a2c77c"/>
    <textElement verticalAlignment="Middle">
     <font size="12" isBold="true"/>
    </textElement>
    <textFieldExpression><![CDATA[$P{FirstDateOfMonth}]]></textFieldExpression>
   </textField>
   <textField>
    <reportElement x="330" y="90" width="190" height="30" uuid="66294bd1-0841-4c2a-b33a-928a0cb1aa0a"/>
    <textElement>
     <font size="12" isBold="true"/>
    </textElement>
    <textFieldExpression><![CDATA[$P{FirstDayOfMonth}]]></textFieldExpression>
   </textField>
   <textField>
    <reportElement x="330" y="120" width="190" height="30" uuid="83fa6364-da26-4578-beaf-58932abc6aab"/>
    <textElement>
     <font size="12" isBold="true"/>
    </textElement>
    <textFieldExpression><![CDATA[$P{DayReturnValueString}]]></textFieldExpression>
   </textField>
   <textField>
    <reportElement x="330" y="150" width="190" height="30" uuid="e341926d-38a0-40e7-b4a6-9232352a7247"/>
    <textElement>
     <font size="12" isBold="true"/>
    </textElement>
    <textFieldExpression><![CDATA[$P{DayReturnValueInteger}]]></textFieldExpression>
   </textField>
   <textField>
    <reportElement x="0" y="30" width="330" height="30" uuid="132ad66e-8839-4c41-8e00-9d77cf0ad6b8"/>
    <textElement verticalAlignment="Middle">
     <font size="12" isBold="true"/>
    </textElement>
    <textFieldExpression><![CDATA["First Date Of Month In TEXT field"]]></textFieldExpression>
   </textField>
   <textField>
    <reportElement x="0" y="60" width="330" height="30" uuid="166e5bec-db19-4a56-a335-470008c8094c"/>
    <textElement verticalAlignment="Middle">
     <font size="12" isBold="true"/>
    </textElement>
    <textFieldExpression><![CDATA["First Date Of Month from Parameter Calcualtion"]]></textFieldExpression>
   </textField>
   <textField>
    <reportElement x="0" y="91" width="330" height="30" uuid="dfd0e3d3-1641-4380-984f-0066d8a9112c"/>
    <textElement verticalAlignment="Middle">
     <font size="12" isBold="true"/>
    </textElement>
    <textFieldExpression><![CDATA["Day Name of First Date Of Month"]]></textFieldExpression>
   </textField>
   <textField>
    <reportElement x="0" y="120" width="330" height="30" uuid="d64905e0-2d87-415f-acab-3747492a2071"/>
    <textElement verticalAlignment="Middle">
     <font size="12" isBold="true"/>
    </textElement>
    <textFieldExpression><![CDATA["Retruning 0,1,2... for Sun, Mon, Tue, ...."+"as a String"]]></textFieldExpression>
   </textField>
   <textField>
    <reportElement x="0" y="150" width="330" height="30" uuid="99f5b0f5-cefb-449b-9edb-e444e4afa5d5"/>
    <textElement verticalAlignment="Middle">
     <font size="12" isBold="true"/>
    </textElement>
    <textFieldExpression><![CDATA["Retruning 0,1,2... for Sun, Mon, Tue, ...."+"as an Integer"]]></textFieldExpression>
   </textField>
   <textField>
    <reportElement x="0" y="0" width="330" height="30" uuid="09477045-1a0c-4c25-8776-715036b8c726"/>
    <textElement verticalAlignment="Middle">
     <font size="12" isBold="true"/>
    </textElement>
    <textFieldExpression><![CDATA["Date Entered"]]></textFieldExpression>
   </textField>
  </band>
 </title>
</jasperReport>

Tip : Adding Text/Static Text labels in Cross Tab Header in Jasper Reports

$
0
0
Hello Folks,

When you design a cross tab in jasper reports, by default the cross tab header will not allow you to resize the dragged text fields or static fields to give row group label names. To overcome this

Do as shown in below

Select the "cross tab header" from its outline, and add "Free Layout" from "Arrange In Container" .


Now, drag and drop text field in tot the container, now the header supports adjusting widths of text fields. 


Reference : 
https://stackoverflow.com/questions/37742859/how-to-add-row-header-to-crosstab

Tip : Adding email hyperlink on text field in Jasper Reports

$
0
0
Hi,

Do get the email box opened on clicking of email type field in report output, it is required to
set below on the field/string type variable in cross tab.

Link Target = Self
Link Type = Reference
Hyperlink Reference Expression = "mailto:"+$V{EmpEmail} where EmpEmail is the string type of variable in cross tab (or it can be any text field on bands or table component)

Example : 2 : "mailto:"+$F{employeeEmail}


Reference: 
https://stackoverflow.com/questions/27239882/how-to-add-email-hyperlink-in-ireport


Thanks
Sadakar

High Charts (HTML-5) Horizontal Bar Chart (Column Chart) advanced properties in jasper reports

$
0
0
Horizontal Bar Chart advanced properties

plotOptions.series.dataLabels.align = right
plotOptions.series.dataLabels.color=white
series.dataLabels.enabled=true
series.dataLabels.format={point.y:.1f}%
tooltip.valueDecimals=new Integer(2)
tooltip.valueSuffix=%


Sample output

Sample JRXML (Supported version : 6.2 Pro or later)
<?xml version="1.0" encoding="UTF-8"?>
<!-- Created with Jaspersoft Studio version 6.2.0.final using JasperReports Library version 6.2.0  -->
<!-- 2017-06-14T01:55:03 -->
<jasperReport xmlns="http://jasperreports.sourceforge.net/jasperreports" xmlns:xsi="http://www.w3.org/2001/XMLSchema-instance" xsi:schemaLocation="http://jasperreports.sourceforge.net/jasperreports http://jasperreports.sourceforge.net/xsd/jasperreport.xsd" name="Bar Chart" pageWidth="1000" pageHeight="842" columnWidth="960" leftMargin="20" rightMargin="20" topMargin="50" bottomMargin="20" uuid="9078ded8-657e-41b9-8a90-552bcd773149">
<property name="com.jaspersoft.studio.data.defaultdataadapter" value="sumtotal_anjan"/>
<property name="com.jaspersoft.studio.data.sql.tables" value=""/>
<property name="com.jaspersoft.studio.unit." value="pixel"/>
<property name="ireport.jasperserver.url" value="http://localhost:8081/jasperserver-pro/"/>
<property name="ireport.jasperserver.user" value="superuser"/>
<property name="ireport.jasperserver.report.resource" value="/Work/Bar_Chart_for_blog_files/main_jrxml"/>
<property name="ireport.jasperserver.reportUnit" value="/Work/Bar_Chart_for_blog"/>
<queryString>
<![CDATA[SELECT productDescription, buyprice FROM classicmodels.products limit 10]]>
</queryString>
<field name="productDescription" class="java.lang.String">
<fieldDescription><![CDATA[]]></fieldDescription>
</field>
<field name="buyprice" class="java.math.BigDecimal">
<fieldDescription><![CDATA[]]></fieldDescription>
</field>
<background>
<band splitType="Stretch"/>
</background>
<summary>
<band height="542">
<componentElement>
<reportElement x="0" y="0" width="960" height="542" uuid="40b3d848-171b-4e69-97f5-4f1d8868a7c3"/>
<hc:chart xmlns:hc="http://jaspersoft.com/highcharts" xsi:schemaLocation="http://jaspersoft.com/highcharts http://jaspersoft.com/schema/highcharts.xsd" type="Bar">
<hc:chartSetting name="default">
<hc:chartProperty name="chart.zoomType">
<hc:propertyExpression><![CDATA["xy"]]></hc:propertyExpression>
</hc:chartProperty>
<hc:chartProperty name="colors">
<hc:propertyExpression><![CDATA[java.util.Arrays.asList("#FF0000","#434348","#90ed7d","#f7a35c","#8085e9","#f15c80","#e4d354","#2b908f","#f45b5b","#91e8e1")]]></hc:propertyExpression>
</hc:chartProperty>
<hc:chartProperty name="credits.enabled">
<hc:propertyExpression><![CDATA[false]]></hc:propertyExpression>
</hc:chartProperty>
<hc:chartProperty name="credits.href">
<hc:propertyExpression><![CDATA[""]]></hc:propertyExpression>
</hc:chartProperty>
<hc:chartProperty name="credits.text">
<hc:propertyExpression><![CDATA[""]]></hc:propertyExpression>
</hc:chartProperty>
<hc:chartProperty name="plotOptions.series.dataLabels.align" value="right"/>
<hc:chartProperty name="plotOptions.series.dataLabels.color" value="#FFFFFF"/>
<hc:chartProperty name="series.dataLabels.enabled" value="true"/>
<hc:chartProperty name="series.dataLabels.format" value="{point.y:.1f}%"/>
<hc:chartProperty name="title.text">
<hc:propertyExpression><![CDATA[""]]></hc:propertyExpression>
</hc:chartProperty>
<hc:chartProperty name="tooltip.useHTML">
<hc:propertyExpression><![CDATA[Boolean.TRUE]]></hc:propertyExpression>
</hc:chartProperty>
<hc:chartProperty name="tooltip.valueDecimals">
<hc:propertyExpression><![CDATA[new Integer(2)]]></hc:propertyExpression>
</hc:chartProperty>
<hc:chartProperty name="tooltip.valuePrefix">
<hc:propertyExpression><![CDATA[""]]></hc:propertyExpression>
</hc:chartProperty>
<hc:chartProperty name="tooltip.valueSuffix">
<hc:propertyExpression><![CDATA["%"]]></hc:propertyExpression>
</hc:chartProperty>
<hc:chartProperty name="xAxis.scrollbar.enabled" value="true"/>
<hc:chartProperty name="yAxis.title.text">
<hc:propertyExpression><![CDATA[""]]></hc:propertyExpression>
</hc:chartProperty>
</hc:chartSetting>
<multiAxisData>
<multiAxisDataset/>
<dataAxis axis="Rows">
<axisLevel name="Level1">
<labelExpression><![CDATA["Level Label expression"]]></labelExpression>
<axisLevelBucket class="java.lang.String">
<bucketExpression><![CDATA[$F{productDescription}]]></bucketExpression>
</axisLevelBucket>
</axisLevel>
</dataAxis>
<dataAxis axis="Columns"/>
<multiAxisMeasure name="Measure1" class="java.lang.Double" calculation="Nothing">
<labelExpression><![CDATA["Description"]]></labelExpression>
<valueExpression><![CDATA[$F{buyprice}]]></valueExpression>
</multiAxisMeasure>
</multiAxisData>
<hc:series name="Measure1"/>
</hc:chart>
</componentElement>
</band>
</summary>
</jasperReport>

Oracle XE listener issue fixing when changing Windows 10 system/computer name

$
0
0

Change the host name with your computer name or localhost in below two files
listener.ora and
tnsnames.ora

Navigation path to the files :
C:\oraclexe\app\oracle\product\11.2.0\server\network\ADMIN

Now, from the windows services, restart OracleXETNSListener and try connecting to XE SID as shown in below image.

Username : sys , Password : tiger (that is given at the time of installation)

Default password is : sysdba for sys user to connect to xe


The reason for changing host name in my case : 
Recently, I have changed the windows 10  system name and from that point of time, I didn't start oracle db in local but today when I started the oracle db and the listener, the connection for xe SID with sys/tiger credentials not worked.

listener.ora

SID_LIST_LISTENER =
  (SID_LIST =
    (SID_DESC =
      (SID_NAME = PLSExtProc)
      (ORACLE_HOME = C:\oraclexe\app\oracle\product\11.2.0\server)
      (PROGRAM = extproc)
    )
    (SID_DESC =
      (SID_NAME = CLRExtProc)
      (ORACLE_HOME = C:\oraclexe\app\oracle\product\11.2.0\server)
      (PROGRAM = extproc)
    )
  )

LISTENER =
  (DESCRIPTION_LIST =
    (DESCRIPTION =
      (ADDRESS = (PROTOCOL = IPC)(KEY = EXTPROC1))
      (ADDRESS = (PROTOCOL = TCP)(HOST = INISAH)(PORT = 1521))
    )
  )

DEFAULT_SERVICE_LISTENER = (XE)


tnsnames.ora
XE =
  (DESCRIPTION =
    (ADDRESS = (PROTOCOL = TCP)(HOST = INISAH)(PORT = 1521))
    (CONNECT_DATA =
      (SERVER = DEDICATED)
      (SERVICE_NAME = XE)
    )
  )

EXTPROC_CONNECTION_DATA =
  (DESCRIPTION =
    (ADDRESS_LIST =
      (ADDRESS = (PROTOCOL = IPC)(KEY = EXTPROC1))
    )
    (CONNECT_DATA =
      (SID = PLSExtProc)
      (PRESENTATION = RO)
    )
  )

ORACLR_CONNECTION_DATA =
  (DESCRIPTION =
    (ADDRESS_LIST =
      (ADDRESS = (PROTOCOL = IPC)(KEY = EXTPROC1))
    )
    (CONNECT_DATA =
      (SID = CLRExtProc)
      (PRESENTATION = RO)
    )
  )


Tip : replaceAll method to remove extra & in a field text in Jasper Reports

$
0
0
This expression in Jasper reports is useful for a text that need to get into a new line whenever an & occurs but the problem is though the text gets into a new line it is displaying an extra & on output. 

Hence, using another replaceAll function from core java for field object we can overcome getting extra &.


Sample Expression:
 $F{ProjectDescription}.replaceAll("lt;br&gt;", "<br>" ).replaceAll("&","")

Tip Credits: Nimmana

Jaspersoft 6.4 : New download Information page- Quick difference between CE & EE

$
0
0

Jaspersoft 6.4 Highlights

  • Extended dashboard authoring for hyperlinking, formatting, and editing
  • Granular admin exporting control
  • Built-in support for popular technologies like Salesforce and PhantomJS
  • Updated interface for designing charts in Jaspersoft Studio

Read Detailed Highlights here :Click this link

Tips : Dates Calculations - Current Month, Previous Month, Next Months (add or substract 1 month, first date of months, day name, day number 0,1..6) in Jasper Reports

$
0
0
It is always fun playing with date related calculations in Jasper reports.

Here is another use case to find out below shown(2nd Image) dates in Jasper Reports.

Sample Design : (Click on image to get best view of content)


Sample Output: (Click on image to get best view of content)


Example Developed in : Jaspersoft Studio Professional 6.4
(NOTE: If you get any error while doing copy paste the below JRXML code, just replace the very first line of xml from other jrxml opened in your studio).


NOTE : 
Analise the calculations in Parameters ( In some cases, we can develop the same using variables)

JRXML : Developed in 6.4 Pro  (Copy - Paste below code in a JRXML opened in your studio)

<?xml version="1.0" encoding="UTF-8"?>
<!-- Created with Jaspersoft Studio version 6.4.0.final using JasperReports Library version 6.4.1  -->
<jasperReport xmlns="http://jasperreports.sourceforge.net/jasperreports" xmlns:xsi="http://www.w3.org/2001/XMLSchema-instance" xsi:schemaLocation="http://jasperreports.sourceforge.net/jasperreports http://jasperreports.sourceforge.net/xsd/jasperreport.xsd" name="Previous and Next Months" pageWidth="1000" pageHeight="842" whenNoDataType="AllSectionsNoDetail" columnWidth="960" leftMargin="20" rightMargin="20" topMargin="20" bottomMargin="20" uuid="be22b853-8ecd-45d5-993a-456ecbf2733b">
    <property name="com.jaspersoft.studio.data.defaultdataadapter" value="One Empty Record"/>
    <property name="com.jaspersoft.studio.unit." value="pixel"/>
    <property name="com.jaspersoft.studio.unit.pageHeight" value="pixel"/>
    <property name="com.jaspersoft.studio.unit.pageWidth" value="pixel"/>
    <property name="com.jaspersoft.studio.unit.topMargin" value="pixel"/>
    <property name="com.jaspersoft.studio.unit.bottomMargin" value="pixel"/>
    <property name="com.jaspersoft.studio.unit.leftMargin" value="pixel"/>
    <property name="com.jaspersoft.studio.unit.rightMargin" value="pixel"/>
    <property name="com.jaspersoft.studio.unit.columnWidth" value="pixel"/>
    <property name="com.jaspersoft.studio.unit.columnSpacing" value="pixel"/>
    <property name="ireport.jasperserver.url" value="http://localhost:8080/jasperserver-pro/"/>
    <property name="ireport.jasperserver.user" value="superuser"/>
    <property name="ireport.jasperserver.report.resource" value="/EarthlySystems/Previous_and_Next_Months_files/main_jrxml"/>
    <property name="ireport.jasperserver.reportUnit" value="/EarthlySystems/Previous_and_Next_Months"/>
    <import value="org.apache.commons.lang.time.*"/>
    <parameter name="Date" class="java.util.Date">
        <defaultValueExpression><![CDATA[new Date()]]></defaultValueExpression>
    </parameter>
    <parameter name="PreviousMonthDate" class="java.util.Date" isForPrompting="false">
        <defaultValueExpression><![CDATA[DateUtils.addMonths($P{Date},-1)]]></defaultValueExpression>
    </parameter>
    <parameter name="NextMonthDate" class="java.util.Date" isForPrompting="false">
        <defaultValueExpression><![CDATA[DateUtils.addMonths($P{Date},1)]]></defaultValueExpression>
    </parameter>
    <parameter name="FirstDateOfCurrentMonth" class="java.lang.String" isForPrompting="false">
        <defaultValueExpression><![CDATA[new SimpleDateFormat("MM/dd/yyyy").format(java.util.Date.parse(MONTH($P{Date}) + "/1/" + YEAR($P{Date})))]]></defaultValueExpression>
    </parameter>
    <parameter name="FirstDayOfCurrentMonth" class="java.lang.String" isForPrompting="false">
        <defaultValueExpression><![CDATA[new SimpleDateFormat("EEE").format(java.util.Date.parse(MONTH($P{Date}) + "/1/" + YEAR($P{Date})))]]></defaultValueExpression>
    </parameter>
    <parameter name="FirstDateOfPreviousMonth" class="java.lang.String" isForPrompting="false">
        <defaultValueExpression><![CDATA[new SimpleDateFormat("MM/dd/yyyy").format(java.util.Date.parse(MONTH($P{PreviousMonthDate}) + "/1/" + YEAR($P{PreviousMonthDate})))]]></defaultValueExpression>
    </parameter>
    <parameter name="FirstDayOfPreviousMonth" class="java.lang.String" isForPrompting="false">
        <defaultValueExpression><![CDATA[new SimpleDateFormat("EEE").format(java.util.Date.parse(MONTH($P{PreviousMonthDate}) + "/1/" + YEAR($P{PreviousMonthDate})))]]></defaultValueExpression>
    </parameter>
    <parameter name="FirstDateOfNextMonth" class="java.lang.String" isForPrompting="false">
        <defaultValueExpression><![CDATA[new SimpleDateFormat("MM/dd/yyyy").format(java.util.Date.parse(MONTH($P{NextMonthDate}) + "/1/" + YEAR($P{NextMonthDate})))]]></defaultValueExpression>
    </parameter>
    <parameter name="FirstDayOfNextMonth" class="java.lang.String" isForPrompting="false">
        <defaultValueExpression><![CDATA[new SimpleDateFormat("EEE").format(java.util.Date.parse(MONTH($P{NextMonthDate}) + "/1/" + YEAR($P{NextMonthDate})))]]></defaultValueExpression>
    </parameter>
    <parameter name="CurrentDateFirstDayValueString" class="java.lang.String" isForPrompting="false">
        <parameterDescription><![CDATA[]]></parameterDescription>
        <defaultValueExpression><![CDATA[$P{FirstDayOfCurrentMonth}.equals("Sun") ? "0":
$P{FirstDayOfCurrentMonth}.equals("Mon") ? "1" :
$P{FirstDayOfCurrentMonth}.equals("Tue") ? "2" :
$P{FirstDayOfCurrentMonth}.equals("Wed") ? "3" :
$P{FirstDayOfCurrentMonth}.equals("Thu") ? "4" :
$P{FirstDayOfCurrentMonth}.equals("Fri") ? "5" :
$P{FirstDayOfCurrentMonth}.equals("Sat") ? "6" : "100"]]></defaultValueExpression>
    </parameter>
    <parameter name="CurrentDateFirstDayValueInteger" class="java.lang.Integer" isForPrompting="false">
        <parameterDescription><![CDATA[]]></parameterDescription>
        <defaultValueExpression><![CDATA[Integer.parseInt($P{CurrentDateFirstDayValueString})]]></defaultValueExpression>
    </parameter>
    <parameter name="PreviousMonthFirstDayValueString" class="java.lang.String" isForPrompting="false">
        <parameterDescription><![CDATA[]]></parameterDescription>
        <defaultValueExpression><![CDATA[$P{FirstDayOfPreviousMonth}.equals("Sun") ? "0":
$P{FirstDayOfPreviousMonth}.equals("Mon") ? "1" :
$P{FirstDayOfPreviousMonth}.equals("Tue") ? "2" :
$P{FirstDayOfPreviousMonth}.equals("Wed") ? "3" :
$P{FirstDayOfPreviousMonth}.equals("Thu") ? "4" :
$P{FirstDayOfPreviousMonth}.equals("Fri") ? "5" :
$P{FirstDayOfPreviousMonth}.equals("Sat") ? "6" : "100"]]></defaultValueExpression>
    </parameter>
    <parameter name="PerviousMonthFirstDayValueInteger" class="java.lang.Integer" isForPrompting="false">
        <parameterDescription><![CDATA[]]></parameterDescription>
        <defaultValueExpression><![CDATA[Integer.parseInt($P{PreviousMonthFirstDayValueString})]]></defaultValueExpression>
    </parameter>
    <parameter name="NextMonthFirstDayValueString" class="java.lang.String" isForPrompting="false">
        <parameterDescription><![CDATA[]]></parameterDescription>
        <defaultValueExpression><![CDATA[$P{FirstDayOfNextMonth}.equals("Sun") ? "0":
$P{FirstDayOfNextMonth}.equals("Mon") ? "1" :
$P{FirstDayOfNextMonth}.equals("Tue") ? "2" :
$P{FirstDayOfNextMonth}.equals("Wed") ? "3" :
$P{FirstDayOfNextMonth}.equals("Thu") ? "4" :
$P{FirstDayOfNextMonth}.equals("Fri") ? "5" :
$P{FirstDayOfNextMonth}.equals("Sat") ? "6" : "100"]]></defaultValueExpression>
    </parameter>
    <parameter name="NextMonthFirstDayValueInteger" class="java.lang.Integer" isForPrompting="false">
        <parameterDescription><![CDATA[]]></parameterDescription>
        <defaultValueExpression><![CDATA[Integer.parseInt($P{NextMonthFirstDayValueString})]]></defaultValueExpression>
    </parameter>
    <queryString>
        <![CDATA[]]>
    </queryString>
    <background>
        <band splitType="Stretch"/>
    </background>
    <title>
        <band height="175" splitType="Stretch">
            <textField>
                <reportElement x="100" y="0" width="100" height="30" uuid="686f531e-d1c4-44ef-884d-378f2a36fc1e"/>
                <textElement verticalAlignment="Middle">
                    <font size="11" isBold="true"/>
                </textElement>
                <textFieldExpression><![CDATA[$P{Date}]]></textFieldExpression>
            </textField>
            <textField>
                <reportElement x="100" y="30" width="100" height="30" uuid="5ca971f8-a82e-4cd2-97b5-9e1e8055e59f">
                    <property name="com.jaspersoft.studio.unit.width" value="pixel"/>
                </reportElement>
                <textElement verticalAlignment="Middle">
                    <font size="11" isBold="true"/>
                </textElement>
                <textFieldExpression><![CDATA[$P{PreviousMonthDate}]]></textFieldExpression>
            </textField>
            <textField>
                <reportElement x="100" y="60" width="100" height="30" uuid="6f1e9e0c-16f7-4ff1-b14f-21d1da654222"/>
                <textElement verticalAlignment="Middle">
                    <font size="11" isBold="true"/>
                </textElement>
                <textFieldExpression><![CDATA[$P{NextMonthDate}]]></textFieldExpression>
            </textField>
            <textField>
                <reportElement x="0" y="0" width="100" height="30" uuid="16e4c44e-16c8-477e-a31d-f8fe7582ae7f"/>
                <textElement verticalAlignment="Middle">
                    <font size="11" isBold="true"/>
                </textElement>
                <textFieldExpression><![CDATA["Current Date"]]></textFieldExpression>
            </textField>
            <textField>
                <reportElement x="0" y="30" width="100" height="30" uuid="0b313be3-2ed2-4f90-933b-cbc57673ea69"/>
                <textElement verticalAlignment="Middle">
                    <font size="11" isBold="true"/>
                </textElement>
                <textFieldExpression><![CDATA["Previous Month"]]></textFieldExpression>
            </textField>
            <textField>
                <reportElement x="0" y="60" width="100" height="30" uuid="a2585866-90c0-4b59-b68a-509247a5927e"/>
                <textElement verticalAlignment="Middle">
                    <font size="11" isBold="true"/>
                </textElement>
                <textFieldExpression><![CDATA["Next Month"]]></textFieldExpression>
            </textField>
            <textField>
                <reportElement x="390" y="0" width="100" height="30" uuid="09a6c4ad-4b9a-43be-a05e-bc57a5b18bf9"/>
                <textElement verticalAlignment="Middle">
                    <font size="11" isBold="true"/>
                </textElement>
                <textFieldExpression><![CDATA[$P{FirstDateOfCurrentMonth}]]></textFieldExpression>
            </textField>
            <textField>
                <reportElement x="230" y="0" width="160" height="30" uuid="b67025b7-8677-4a3f-8f8d-1162bf7d26e3"/>
                <textElement verticalAlignment="Middle">
                    <font size="11" isBold="true"/>
                </textElement>
                <textFieldExpression><![CDATA["First Date of Current Month"]]></textFieldExpression>
            </textField>
            <textField>
                <reportElement x="670" y="0" width="100" height="30" uuid="421e66b1-d745-4117-bee0-0af184eaca3d"/>
                <textElement verticalAlignment="Middle">
                    <font size="11" isBold="true"/>
                </textElement>
                <textFieldExpression><![CDATA[$P{FirstDayOfCurrentMonth}]]></textFieldExpression>
            </textField>
            <textField>
                <reportElement x="510" y="0" width="160" height="30" uuid="d180e9ba-ae84-4b94-9b51-43648bba475a"/>
                <textElement verticalAlignment="Middle">
                    <font size="11" isBold="true"/>
                </textElement>
                <textFieldExpression><![CDATA["First Day of Current Month"]]></textFieldExpression>
            </textField>
            <textField>
                <reportElement x="230" y="30" width="160" height="30" uuid="7157a773-e62f-4e0c-9f03-4696a30a9136"/>
                <textElement verticalAlignment="Middle">
                    <font size="11" isBold="true"/>
                </textElement>
                <textFieldExpression><![CDATA["First Date of Previous Month"]]></textFieldExpression>
            </textField>
            <textField>
                <reportElement x="390" y="30" width="100" height="30" uuid="3d3ed51e-f5f0-4892-9c42-ae52ef3b7651"/>
                <textElement verticalAlignment="Middle">
                    <font size="11" isBold="true"/>
                </textElement>
                <textFieldExpression><![CDATA[$P{FirstDateOfPreviousMonth}]]></textFieldExpression>
            </textField>
            <textField>
                <reportElement x="510" y="30" width="160" height="30" uuid="b384ade7-ea31-45ec-a756-82c37b8f6e02"/>
                <textElement verticalAlignment="Middle">
                    <font size="11" isBold="true"/>
                </textElement>
                <textFieldExpression><![CDATA["First Day of Previous Month"]]></textFieldExpression>
            </textField>
            <textField>
                <reportElement x="670" y="30" width="100" height="30" uuid="4990802a-be00-4306-91f6-1a5e50c4bc98"/>
                <textElement verticalAlignment="Middle">
                    <font size="11" isBold="true"/>
                </textElement>
                <textFieldExpression><![CDATA[$P{FirstDayOfPreviousMonth}]]></textFieldExpression>
            </textField>
            <textField>
                <reportElement x="230" y="60" width="160" height="30" uuid="87c32b3a-5794-4853-b5de-129f0273b839"/>
                <textElement verticalAlignment="Middle">
                    <font size="11" isBold="true"/>
                </textElement>
                <textFieldExpression><![CDATA["First Date of Next  Month"]]></textFieldExpression>
            </textField>
            <textField>
                <reportElement x="390" y="60" width="100" height="30" uuid="5d12680a-5c90-4b9f-af78-c41df1c5167d"/>
                <textElement verticalAlignment="Middle">
                    <font size="11" isBold="true"/>
                </textElement>
                <textFieldExpression><![CDATA[$P{FirstDateOfNextMonth}]]></textFieldExpression>
            </textField>
            <textField>
                <reportElement x="510" y="60" width="160" height="30" uuid="c981572c-6f18-4eb9-a7b9-d875d19f26ca"/>
                <textElement verticalAlignment="Middle">
                    <font size="11" isBold="true"/>
                </textElement>
                <textFieldExpression><![CDATA["First Day of Next  Month"]]></textFieldExpression>
            </textField>
            <textField>
                <reportElement x="670" y="60" width="100" height="30" uuid="77c38b0a-3206-4767-9519-0e497db7cbe0"/>
                <textElement verticalAlignment="Middle">
                    <font size="11" isBold="true"/>
                </textElement>
                <textFieldExpression><![CDATA[$P{FirstDayOfNextMonth}]]></textFieldExpression>
            </textField>
            <textField>
                <reportElement x="770" y="0" width="80" height="30" uuid="259b0efd-cf1c-4963-a4e3-1785d602d59c"/>
                <textElement textAlignment="Left" verticalAlignment="Middle">
                    <font size="11" isBold="true"/>
                </textElement>
                <textFieldExpression><![CDATA[$P{CurrentDateFirstDayValueInteger}]]></textFieldExpression>
            </textField>
            <textField>
                <reportElement x="770" y="30" width="80" height="30" uuid="f10baf74-a727-48d9-bfcf-1b6d3452736f"/>
                <textElement textAlignment="Left" verticalAlignment="Middle">
                    <font size="11" isBold="true"/>
                </textElement>
                <textFieldExpression><![CDATA[$P{PerviousMonthFirstDayValueInteger}]]></textFieldExpression>
            </textField>
            <textField>
                <reportElement x="770" y="60" width="80" height="30" uuid="71be88e2-4893-41d5-bef4-6bbdb4cb7c6a"/>
                <textElement textAlignment="Left" verticalAlignment="Middle">
                    <font size="11" isBold="true"/>
                </textElement>
                <textFieldExpression><![CDATA[$P{NextMonthFirstDayValueInteger}]]></textFieldExpression>
            </textField>
            <textField hyperlinkType="ReportExecution" hyperlinkTarget="Blank">
                <reportElement x="139" y="126" width="281" height="30" uuid="7d969a03-940c-4081-8210-d90686c0ae5c"/>
                <textElement>
                    <font size="14"/>
                </textElement>
                <textFieldExpression><![CDATA["Previous Month"]]></textFieldExpression>
                <hyperlinkParameter name="_report">
                    <hyperlinkParameterExpression><![CDATA["/EarthlySystems/Previous_and_Next_Months"]]></hyperlinkParameterExpression>
                </hyperlinkParameter>
                <hyperlinkParameter name="Date">
                    <hyperlinkParameterExpression><![CDATA[$P{PreviousMonthDate}]]></hyperlinkParameterExpression>
                </hyperlinkParameter>
                <hyperlinkParameter name="DayReturnValueInteger">
                    <hyperlinkParameterExpression><![CDATA[$P{PerviousMonthFirstDayValueInteger}]]></hyperlinkParameterExpression>
                </hyperlinkParameter>
            </textField>
            <textField hyperlinkType="ReportExecution" hyperlinkTarget="Blank">
                <reportElement x="440" y="126" width="281" height="30" uuid="64116c95-e582-476e-b5ca-fe88e26c7d77"/>
                <textElement>
                    <font size="14"/>
                </textElement>
                <textFieldExpression><![CDATA["Next  Month"]]></textFieldExpression>
                <hyperlinkParameter name="_report">
                    <hyperlinkParameterExpression><![CDATA["/EarthlySystems/Previous_and_Next_Months"]]></hyperlinkParameterExpression>
                </hyperlinkParameter>
                <hyperlinkParameter name="Date">
                    <hyperlinkParameterExpression><![CDATA[$P{NextMonthDate}]]></hyperlinkParameterExpression>
                </hyperlinkParameter>
                <hyperlinkParameter name="DayReturnValueInteger">
                    <hyperlinkParameterExpression><![CDATA[$P{NextMonthFirstDayValueInteger}]]></hyperlinkParameterExpression>
                </hyperlinkParameter>
            </textField>
        </band>
    </title>
    <pageHeader>
        <band height="35" splitType="Stretch"/>
    </pageHeader>
    <columnHeader>
        <band height="61" splitType="Stretch"/>
    </columnHeader>
    <detail>
        <band height="125" splitType="Stretch"/>
    </detail>
    <columnFooter>
        <band height="45" splitType="Stretch"/>
    </columnFooter>
    <pageFooter>
        <band height="54" splitType="Stretch"/>
    </pageFooter>
    <summary>
        <band height="42" splitType="Stretch"/>
    </summary>
</jasperReport>


I hope it helps some one in community.!

Cheers.!
Sadakar Pochampalli

Tip : configure the "names" of the labels and "percentages"of pie highchart(HTML-5) in jaspersoft studio 6.4 pro.

$
0
0
Hi,

Over a period of time, the product(jaspersoft) has improved by leaps and bounds .Though it had gained developer(s) attention, one may feel ambiguous in finding a particular property in highcharts advanced properties. So far, I found there are no cut corners instead to spend some good amount of time and the article is the outcome of latter.

Today, I have come across the titled task of this post and thought to put in this bank. You will see how to configure the "name(s)" of the label and "percentage(s)"of highcharts(HTML-5) in jaspersoft studio 6.4 pro.

The below property, you need to set in Advanced properties of HTML-5 pie chart and the following images will help you out where exactly you need to configure it.

plotOptions.pie.dataLabels.format = "{point.name} {point.percentage:.0f}%" 


Click on images to get the best sight of content highlighted. 


1) 


2)
3)

 4)

5)

Until the next tip.!

- Sadakar Pochampalli

Tip : Pie chart tittle in middle of chart in Jasper reports high charts

$
0
0


<hc:chartProperty name="title.text" value="Chart Title in Center"/>
<hc:chartProperty name="title.verticalAlign" value="middle"/>
<hc:chartProperty name="title.floating_customSimpleMode" value="true"/>
<hc:chartProperty name="title.floating">


JRXML : Supports in 6.4 or later Pro

<?xml version="1.0" encoding="UTF-8"?>
<!-- Created with Jaspersoft Studio version 6.4.0.final using JasperReports Library version 6.4.1  -->
<jasperReport xmlns="http://jasperreports.sourceforge.net/jasperreports" xmlns:xsi="http://www.w3.org/2001/XMLSchema-instance" xsi:schemaLocation="http://jasperreports.sourceforge.net/jasperreports http://jasperreports.sourceforge.net/xsd/jasperreport.xsd" name="Task_25_Oct_2017" pageWidth="595" pageHeight="842" whenNoDataType="AllSectionsNoDetail" columnWidth="555" leftMargin="20" rightMargin="20" topMargin="20" bottomMargin="20" uuid="62bf9297-750d-475a-94b8-bfd486dc5f00">
<property name="com.jaspersoft.studio.data.sql.tables" value=""/>
<property name="com.jaspersoft.studio.data.defaultdataadapter" value="foodmart"/>
<property name="ireport.jasperserver.url" value="http://localhost:8080/jasperserver-pro/"/>
<property name="ireport.jasperserver.user" value="superuser"/>
<property name="ireport.jasperserver.report.resource" value="/EarthlySystems/Task_25_Oct_2017_files/main_jrxml"/>
<property name="ireport.jasperserver.reportUnit" value="/EarthlySystems/Task_25_Oct_2017"/>
<subDataset name="Dataset1_Donut" uuid="b8746b75-d0d2-4837-9d6e-bf909eee2911">
<property name="com.jaspersoft.studio.data.sql.tables" value=""/>
<property name="com.jaspersoft.studio.data.defaultdataadapter" value="foodmart"/>
<queryString language="SQL">
<![CDATA[(SELECT 'Slice1' AS category, 15 AS value FROM customer limit 1)
UNION ALL
(SELECT 'Slice2' AS category,75 AS Value FROM customer limit 1)]]>
</queryString>
<field name="category" class="java.lang.String"/>
<field name="value" class="java.lang.Integer"/>
</subDataset>
<queryString language="SQL">
<![CDATA[]]>
</queryString>
<title>
<band height="320" splitType="Stretch">
<componentElement>
<reportElement x="60" y="0" width="400" height="320" uuid="9c464bcb-b23c-47d8-9b02-b0413f44c203">
<property name="com.jaspersoft.studio.unit.height" value="pixel"/>
<property name="com.jaspersoft.studio.unit.width" value="pixel"/>
</reportElement>
<hc:chart xmlns:hc="http://jaspersoft.com/highcharts" xsi:schemaLocation="http://jaspersoft.com/highcharts http://jaspersoft.com/schema/highcharts.xsd" type="Pie">
<hc:chartSetting name="default">
<hc:chartProperty name="title.text" value="Chart Title in Center"/>
<hc:chartProperty name="credits.enabled" value="false"/>
<hc:chartProperty name="credits.href" value=""/>
<hc:chartProperty name="credits.text" value=""/>
<hc:chartProperty name="yAxis.title.text" value=""/>
<hc:chartProperty name="chart.zoomType" value="xy"/>
<hc:chartProperty name="plotOptions.pie.showInLegend" value="false"/>
<hc:chartProperty name="legend.enabled_customSimpleMode" value="true"/>
<hc:chartProperty name="legend.enabled">
<hc:propertyExpression><![CDATA[false]]></hc:propertyExpression>
</hc:chartProperty>
<hc:chartProperty name="plotOptions.pie.dataLabels.enabled">
<hc:propertyExpression><![CDATA[false]]></hc:propertyExpression>
</hc:chartProperty>
<hc:chartProperty name="plotOptions.pie.innerSize" value="90%"/>
<hc:chartProperty name="plotOptions.pie.dataLabels.padding" value="0"/>
<hc:chartProperty name="title.verticalAlign" value="middle"/>
<hc:chartProperty name="title.floating_customSimpleMode" value="true"/>
<hc:chartProperty name="title.floating">
<hc:propertyExpression><![CDATA[true]]></hc:propertyExpression>
</hc:chartProperty>
<hc:chartProperty name="title.style.fontSize" value="14px"/>
<hc:chartProperty name="title.style.color" value="#C8CACF"/>
</hc:chartSetting>
<multiAxisData>
<multiAxisDataset>
<dataset>
<datasetRun subDataset="Dataset1_Donut" uuid="50243b95-3f10-43db-8d71-f23638e513b4"/>
</dataset>
</multiAxisDataset>
<dataAxis axis="Rows">
<axisLevel name="Level1">
<labelExpression><![CDATA["Level Label expression"]]></labelExpression>
<axisLevelBucket class="java.lang.String">
<bucketExpression><![CDATA[$F{category}]]></bucketExpression>
</axisLevelBucket>
</axisLevel>
</dataAxis>
<dataAxis axis="Columns"/>
<multiAxisMeasure name="Measure1" class="java.lang.Number" calculation="Nothing">
<labelExpression><![CDATA["Category:"]]></labelExpression>
<valueExpression><![CDATA[$F{value}]]></valueExpression>
</multiAxisMeasure>
</multiAxisData>
<hc:series name="Measure1"/>
</hc:chart>
</componentElement>
</band>
</title>
</jasperReport>

Domain row-level security example in Jaspersoft - retrieve specific customer data based on logged in user

$
0
0
Hi folks,

Happy New Year.! 2018.

It's been a long time, I have shared a technical write-up in Jaspersoft BI.

Today, here I come with an interesting concept, that is how to restrict the data for specific customers based on logged in user.

In this article, you will see, an end-to-end example starting from domain creation to ad-hoc view and then show you how to restrict the data.


The example(project zip file and explanation) is available as word document which you can download by clicking this link.


This example is also available in my YouTube channel. Watch out the video tutorial for the demonstration here

Page-1 Sample content 

Use case: Display brand wise store cost of customers in cross tabular (or pivot) view using ad-hoc reports.

To keep the demonstration simple and easy to understand the concept, let us take below three tables from foodmart database.

Tables: customer, product and sales_fact_1997

Let’s say customer1_userbelongs to "Alexandra Meyer"customer, customer2_user belongs to “Cathy Bohn” customer respectively and these users are created manually or populated by an ETL tool to the jaspersoft server (to jasperserver database).

When customer1_userlogs in and run the ad-hoc view/report he should be able to see only the data related to him and vice versa for the customer2_user


Page-4 Sample content 


Page-6 Sample content 

Sample snapshot of restricted data for customer1_user 


Read the full content by downloading the word/pdf document by clicking this link.


Stay tuned for more updates - an year for learning advanced concepts in Jaspersoft. 


Thank you
Until next, 
Sadakar Pochampalli 
Viewing all 261 articles
Browse latest View live


<script src="https://jsc.adskeeper.com/r/s/rssing.com.1596347.js" async> </script>