Quantcast
Viewing all 261 articles
Browse latest View live

Tip : Tab space issue with Field when its value having more characters

Hi,

Problem Statement : 
In some requirements, we need to print larger text value of a field in the reports & we do it dragging to the report console as usual but will stop with an error saying
java.lang.ArrayIndexOutOfBoundsException: 0 with out further error message. 

Solution : 
Its because  of the no compatability conversion understanding of SQL and Java to handle the spaces or tab spaces in the string value. 

We can overcome it at SQL level by using "replace" funciton. 

Lets say, the column name could be ProjectDescription in the SQL code. 
 & Lets assume one of the values for it is "This is a reporting project, this report is used to find the maximum of something and etc ..........up to some 3000 characters description". 

In SQL code use "replace" function to the field as shown below. 

Syntax : 
" replace([column_name], CHR(9))  " 
Example : 
replace(ProjectDescription,CHR(9))

 NOTE :
# This example is Oracle SQL specific, if you are working on other DBMS soft wares, find the similar replace function it and test. 

Similar issues can be found at below threads from community
1) http://community.jaspersoft.com/jasperreports-library/issues/4631
2) http://community.jaspersoft.com/questions/803333/tabs-text-mess-pdf-output
3) http://community.jaspersoft.com/questions/532690/using-tab-escape-sequence-text-field-expression

I hope this helps some one. !

Cheers..!
:-) :-) 
 

Tip : Highcharts advanced properties for bar chart - Display vertical labels on bar

Hi folks,
Here is the small workout. Hope you may find it useful.

Requirement is subjected to this post. :-)

Steps : 
1) Right click on the bar chart ( Column vertical bar chart).
2) Click on "Show Advanced Properties"
3) Click on "Add" button to add below 3 properties.
plotOptions.series.dataLabels.enabled = true
NOTE :
# no double quotes for true & check tick mark of Use an expression
# This property enables the data values to show on bar(values would be outside of bar).

plotOptions.series.dataLabels.rotation= new Integer(90) 
NOTE:
# check the tick mark of Use an expression
# This property rotates the data values vertically on bar.

plotOptions.series.dataLabels.y= new Integer(-20) 
NOTE:
# check the tick mark of Use an expression
# This property is used to give the distance to the value vertically from the bar top. 

Sample output : 


How to in JRXML ?

  JRXML Code : 
(It works on foodmart database of Jasper postgresql & works with professional jasper studio only).

<?xml version="1.0" encoding="UTF-8"?>
<!-- Created with Jaspersoft Studio version 6.0.1.final using JasperReports Library version 6.0.0  -->
<!-- 2015-12-07T20:52:05 -->
<jasperReport xmlns="http://jasperreports.sourceforge.net/jasperreports" xmlns:xsi="http://www.w3.org/2001/XMLSchema-instance" xsi:schemaLocation="http://jasperreports.sourceforge.net/jasperreports http://jasperreports.sourceforge.net/xsd/jasperreport.xsd" name="Blank_A4" pageWidth="595" pageHeight="842" columnWidth="555" leftMargin="20" rightMargin="20" topMargin="20" bottomMargin="20" uuid="82e08b7f-0e4f-4aae-8514-6cdd45c368bf">
    <property name="com.jaspersoft.studio.data.defaultdataadapter" value="foodmart - postgres"/>
    <property name="ireport.jasperserver.url" value="http://localhost:8080/jasperserver-pro/"/>
    <property name="ireport.jasperserver.user" value="superuser"/>
    <property name="ireport.jasperserver.report.resource" value="/Explore/HTML5BarChart2_files/main_jrxml"/>
    <property name="ireport.jasperserver.reportUnit" value="/Explore/HTML5BarChart2"/>
    <queryString language="SQL">
        <![CDATA[SELECT occupation,state_province, SUM(num_cars_owned) cars FROM customer c GROUP BY occupation ,state_province ORDER BY occupation ,state_province ]]>
    </queryString>
    <field name="occupation" class="java.lang.String"/>
    <field name="state_province" class="java.lang.String"/>
    <field name="cars" class="java.lang.Long"/>
    <background>
        <band splitType="Stretch"/>
    </background>
    <summary>
        <band height="343" splitType="Stretch">
            <componentElement>
                <reportElement x="0" y="0" width="555" height="343" uuid="a5884ec2-1cf0-447b-b1dc-ba58f5056eba"/>
                <hc:chart xmlns:hc="http://jaspersoft.com/highcharts" xsi:schemaLocation="http://jaspersoft.com/highcharts http://jaspersoft.com/schema/highcharts.xsd" type="Column">
                    <hc:chartSetting name="default">
                        <hc:chartProperty name="_showMeasureNameOnValueAxis">
                            <hc:propertyExpression><![CDATA[Boolean.TRUE]]></hc:propertyExpression>
                        </hc:chartProperty>
                        <hc:chartProperty name="chart.zoomType">
                            <hc:propertyExpression><![CDATA["xy"]]></hc:propertyExpression>
                        </hc:chartProperty>
                        <hc:chartProperty name="credits.enabled">
                            <hc:propertyExpression><![CDATA[false]]></hc:propertyExpression>
                        </hc:chartProperty>
                        <hc:chartProperty name="credits.href">
                            <hc:propertyExpression><![CDATA[""]]></hc:propertyExpression>
                        </hc:chartProperty>
                        <hc:chartProperty name="credits.text">
                            <hc:propertyExpression><![CDATA[""]]></hc:propertyExpression>
                        </hc:chartProperty>
                        <hc:chartProperty name="plotOptions.series.dataLabels.enabled">
                            <hc:propertyExpression><![CDATA[true]]></hc:propertyExpression>
                        </hc:chartProperty>
                        <hc:chartProperty name="plotOptions.series.dataLabels.rotation">
                            <hc:propertyExpression><![CDATA[new Integer(90)]]></hc:propertyExpression>
                        </hc:chartProperty>
                        <hc:chartProperty name="plotOptions.series.dataLabels.y">
                            <hc:propertyExpression><![CDATA[new Integer(-20)]]></hc:propertyExpression>
                        </hc:chartProperty>
                        <hc:chartProperty name="title.text">
                            <hc:propertyExpression><![CDATA[""]]></hc:propertyExpression>
                        </hc:chartProperty>
                        <hc:chartProperty name="yAxis.title.text">
                            <hc:propertyExpression><![CDATA["Measure label expression"]]></hc:propertyExpression>
                        </hc:chartProperty>
                    </hc:chartSetting>
                    <multiAxisData>
                        <multiAxisDataset/>
                        <dataAxis axis="Rows">
                            <axisLevel name="Level1">
                                <labelExpression><![CDATA["Level Label expression"]]></labelExpression>
                                <axisLevelBucket class="java.lang.String">
                                    <bucketExpression><![CDATA[$F{occupation}]]></bucketExpression>
                                </axisLevelBucket>
                            </axisLevel>
                        </dataAxis>
                        <dataAxis axis="Columns"/>
                        <multiAxisMeasure name="Measure1" class="java.lang.Integer" calculation="Nothing">
                            <labelExpression><![CDATA["Measure label expression"]]></labelExpression>
                            <valueExpression><![CDATA[$F{cars}]]></valueExpression>
                        </multiAxisMeasure>
                    </multiAxisData>
                    <hc:series name="Measure1"/>
                </hc:chart>
            </componentElement>
        </band>
    </summary>
</jasperReport>


References : 
1) http://api.highcharts.com/highcharts#plotOptions.series.dataLabels 
2) http://jsfiddle.net/gh/get/jquery/1.7.2/highslide-software/highcharts.com/tree/master/samples/highcharts/plotoptions/series-datalabels-align-left/ 
3) http://jsfiddle.net/gh/get/jquery/1.7.2/highslide-software/highcharts.com/tree/master/samples/highcharts/plotoptions/series-datalabels-rotation/
4) http://community.jaspersoft.com/wiki/advanced-formatting-new-html5-charts

100% horizontal stacked percentage bar chart example in Jasper Reports 6.x (or) How to get %'s on stacks, color for data values

Hi Folks,

This post will teach you how to work with 100% horizontal stacked highcharts bar chart in Jasper reports and how to work with Advanced properties of it.

I hope this would help some one in saving their(s) time.

Software used to test this example : 
1) Jasper Design Studio 6.1
2) foodmart database of postgresql
3) Jasper Server 6.0.1 professional & Mozilla firefox web browser.

Sample output of the report : 
I hope you have already knew how to create a new report hence skipping some basic steps and concentrating in explaining core parts.
1) Sample Query Design
SELECT
    occupation,
    state_province,
    SUM(num_cars_owned) cars
FROM customer c
WHERE state_province IN('CA','WA','OR')
GROUP BY
    occupation ,
    state_province
ORDER BY
    occupation,
    state_province

2) Sample output of the query 

3) Drag and drop "StackedPercBar" chart from HTML-5 charts component from Palette section.

4)  Right click on it get the chart properties.
   In chart data section & under configuration tab give below.
Category : $F{occupation} (of java.lang.String type)
Series : $F{state_province} (of java.lang.String type)
Measures : $F{cars} (of java.lang.Integer type)

5) Come back to the chart properties and click on Advanced Properties and click on "Add" button to add below properties.

plotOptions.series.dataLabels.enabled = ture
(Tick the check box) - to enable the values
plotOptions.series.dataLabels.format =" {point.percentage:.0f} % "
(tick the check box) - to get the %'s
plotOptions.series.dataLabels.color = #FF0000
(do not check the tick box) - to get the colors for values

See below image for accuracy 


6) Save the report, publish it the server and have preview. Output should look as shown in first image to this post.

JRXML code : (copy paste the code to get the same copy in your JRXML source , note that it will only work in professional studio or iReport).

<?xml version="1.0" encoding="UTF-8"?>
<!-- Created with Jaspersoft Studio version 6.0.1.final using JasperReports Library version 6.0.0  -->
<!-- 2015-12-07T21:20:57 -->
<jasperReport xmlns="http://jasperreports.sourceforge.net/jasperreports" xmlns:xsi="http://www.w3.org/2001/XMLSchema-instance" xsi:schemaLocation="http://jasperreports.sourceforge.net/jasperreports http://jasperreports.sourceforge.net/xsd/jasperreport.xsd" name="Blank_A4_1" pageWidth="595" pageHeight="842" columnWidth="555" leftMargin="20" rightMargin="20" topMargin="20" bottomMargin="20" uuid="f8b9b5a2-390b-4136-94c7-00c39ec1a61d">
    <property name="com.jaspersoft.studio.data.defaultdataadapter" value="foodmart"/>
    <property name="ireport.jasperserver.url" value="http://localhost:8080/jasperserver-pro/"/>
    <property name="ireport.jasperserver.user" value="superuser"/>
    <property name="ireport.jasperserver.report.resource" value="/Explore/HTML5BarChart_files/main_jrxml"/>
    <property name="ireport.jasperserver.reportUnit" value="/Explore/HTML5BarChart"/>
    <queryString language="SQL">
        <![CDATA[SELECT
    occupation,
    state_province,
    SUM(num_cars_owned) cars
FROM customer c
WHERE state_province IN('CA','WA','OR')
GROUP BY
    occupation ,
    state_province
ORDER BY
    occupation,
    state_province
]]>
    </queryString>
    <field name="occupation" class="java.lang.String"/>
    <field name="cars" class="java.lang.Long"/>
    <field name="state_province" class="java.lang.String"/>
    <background>
        <band splitType="Stretch"/>
    </background>
    <summary>
        <band height="340" splitType="Stretch">
            <componentElement>
                <reportElement x="0" y="0" width="555" height="340" uuid="b2a63a16-5851-438a-af78-98a11b27ddf3"/>
                <hc:chart xmlns:hc="http://jaspersoft.com/highcharts" xsi:schemaLocation="http://jaspersoft.com/highcharts http://jaspersoft.com/schema/highcharts.xsd" type="StackedPercentBar">
                    <hc:chartSetting name="default">
                        <hc:chartProperty name="chart.zoomType">
                            <hc:propertyExpression><![CDATA["xy"]]></hc:propertyExpression>
                        </hc:chartProperty>
                        <hc:chartProperty name="credits.enabled">
                            <hc:propertyExpression><![CDATA[false]]></hc:propertyExpression>
                        </hc:chartProperty>
                        <hc:chartProperty name="credits.href">
                            <hc:propertyExpression><![CDATA[""]]></hc:propertyExpression>
                        </hc:chartProperty>
                        <hc:chartProperty name="credits.text">
                            <hc:propertyExpression><![CDATA[""]]></hc:propertyExpression>
                        </hc:chartProperty>
                        <hc:chartProperty name="legend.enabled">
                            <hc:propertyExpression><![CDATA[Boolean.FALSE]]></hc:propertyExpression>
                        </hc:chartProperty>
                        <hc:chartProperty name="plotOptions.series.allowPointSelect">
                            <hc:propertyExpression><![CDATA[Boolean.TRUE]]></hc:propertyExpression>
                        </hc:chartProperty>
                        <hc:chartProperty name="plotOptions.series.connectNulls">
                            <hc:propertyExpression><![CDATA[Boolean.TRUE]]></hc:propertyExpression>
                        </hc:chartProperty>
                        <hc:chartProperty name="plotOptions.series.dataLabels.color" value="#FF0000"/>
                        <hc:chartProperty name="plotOptions.series.dataLabels.enabled">
                            <hc:propertyExpression><![CDATA[true]]></hc:propertyExpression>
                        </hc:chartProperty>
                        <hc:chartProperty name="plotOptions.series.dataLabels.format">
                            <hc:propertyExpression><![CDATA[" {point.percentage:.0f} % "]]></hc:propertyExpression>
                        </hc:chartProperty>
                        <hc:chartProperty name="plotOptions.series.selected">
                            <hc:propertyExpression><![CDATA[Boolean.TRUE]]></hc:propertyExpression>
                        </hc:chartProperty>
                        <hc:chartProperty name="plotOptions.series.showCheckBox">
                            <hc:propertyExpression><![CDATA[Boolean.TRUE]]></hc:propertyExpression>
                        </hc:chartProperty>
                        <hc:chartProperty name="title.text">
                            <hc:propertyExpression><![CDATA[""]]></hc:propertyExpression>
                        </hc:chartProperty>
                        <hc:chartProperty name="yAxis.title.text">
                            <hc:propertyExpression><![CDATA[""]]></hc:propertyExpression>
                        </hc:chartProperty>
                    </hc:chartSetting>
                    <multiAxisData>
                        <multiAxisDataset/>
                        <dataAxis axis="Rows">
                            <axisLevel name="Level1">
                                <labelExpression><![CDATA["Level Label expression"]]></labelExpression>
                                <axisLevelBucket class="java.lang.String">
                                    <bucketExpression><![CDATA[$F{occupation}]]></bucketExpression>
                                </axisLevelBucket>
                            </axisLevel>
                        </dataAxis>
                        <dataAxis axis="Columns">
                            <axisLevel name="state_province">
                                <labelExpression><![CDATA[]]></labelExpression>
                                <axisLevelBucket order="None" class="java.lang.String">
                                    <bucketExpression><![CDATA[$F{state_province}]]></bucketExpression>
                                </axisLevelBucket>
                            </axisLevel>
                        </dataAxis>
                        <multiAxisMeasure name="cars" class="java.lang.Integer" calculation="Nothing">
                            <labelExpression><![CDATA["Measure label expression"]]></labelExpression>
                            <valueExpression><![CDATA[$F{cars}]]></valueExpression>
                        </multiAxisMeasure>
                    </multiAxisData>
                    <hc:series name="cars"/>
                </hc:chart>
            </componentElement>
        </band>
    </summary>
</jasperReport>

Thank you for reading this post.

If you find it useful, please hit the share button to help the community.

Cheers.!
Sadakar Pochampalli


Tip : Set RoundingMode.DOWN for Double/Big Decimal types in Jasper Reports 6.x


This post will give you the inputs on how to get the non rounded(exact values) after decimal points for Double or Big Decimal types in Jasper Reports/(Java).

There are situations in reporting to display the exact values after decimal point for some purpose.

For example : 
4.53455 should get printed as 4.53
0.234 should get printed as 0.23,
0.057 should get printed as 0.05 (but not 0.06 by rounding)
0.389 should get printed as 0.38 (but not 0.39 by rounding)

The above implementation in  JAVA is pretty easy but in jasper it would be a tricky as shown in below examples.

Examples : 
new BigDecimal(new Double(0.05592538471251264)).setScale(1, RoundingMode.DOWN)

new BigDecimal(new Double(1.9596988841721044)).setScale(1, RoundingMode.DOWN)

new BigDecimal(new Double(91.0)).setScale(1, RoundingMode.DOWN)

new BigDecimal(new Double(.0)).setScale(1, RoundingMode.DOWN)

Sample output : 
 
Sample JRXML :  ( Copy paste the below code in your source in professional studio)

<?xml version="1.0" encoding="UTF-8"?>
<!-- Created with Jaspersoft Studio version 6.0.1.final using JasperReports Library version 6.0.0  -->
<!-- 2015-12-08T13:29:09 -->
<jasperReport xmlns="http://jasperreports.sourceforge.net/jasperreports" xmlns:xsi="http://www.w3.org/2001/XMLSchema-instance" xsi:schemaLocation="http://jasperreports.sourceforge.net/jasperreports http://jasperreports.sourceforge.net/xsd/jasperreport.xsd" name="Blank_A4_1" pageWidth="595" pageHeight="842" whenNoDataType="AllSectionsNoDetail" columnWidth="555" leftMargin="20" rightMargin="20" topMargin="20" bottomMargin="20" uuid="927e91d9-da47-46ff-b6a9-744c47f3dff0">
    <property name="com.jaspersoft.studio.data.defaultdataadapter" value="One Empty Record"/>
    <queryString>
        <![CDATA[]]>
    </queryString>
    <title>
        <band height="298" splitType="Stretch">
            <textField>
                <reportElement mode="Opaque" x="153" y="72" width="180" height="40" backcolor="#BFF2CF" uuid="a39e7410-e811-4545-81b2-94d0239c43ee"/>
                <box rightPadding="10">
                    <topPen lineWidth="0.5" lineStyle="Solid" lineColor="#000000"/>
                    <leftPen lineWidth="0.5" lineStyle="Solid" lineColor="#000000"/>
                    <bottomPen lineWidth="0.5" lineStyle="Solid" lineColor="#000000"/>
                    <rightPen lineWidth="0.5" lineStyle="Solid" lineColor="#000000"/>
                </box>
                <textElement textAlignment="Right" verticalAlignment="Middle">
                    <font size="12"/>
                </textElement>
                <textFieldExpression><![CDATA[String.format("%.1f",0.05592538471251264)]]></textFieldExpression>
            </textField>
            <textField>
                <reportElement mode="Opaque" x="153" y="122" width="180" height="30" backcolor="#EFDAF7" uuid="69394848-d852-4f9f-b3b3-f644e06608ed"/>
                <box rightPadding="10">
                    <topPen lineWidth="0.5" lineStyle="Solid" lineColor="#000000"/>
                    <leftPen lineWidth="0.5" lineStyle="Solid" lineColor="#000000"/>
                    <bottomPen lineWidth="0.5" lineStyle="Solid" lineColor="#000000"/>
                    <rightPen lineWidth="0.5" lineStyle="Solid" lineColor="#000000"/>
                </box>
                <textElement textAlignment="Right" verticalAlignment="Middle">
                    <font size="12"/>
                </textElement>
                <textFieldExpression><![CDATA[new BigDecimal(new Double(0.05592538471251264)).setScale(1, RoundingMode.DOWN)]]></textFieldExpression>
            </textField>
            <textField>
                <reportElement mode="Opaque" x="-1" y="122" width="154" height="30" backcolor="#EFDAF7" uuid="4b65ff63-e767-43a4-806e-0b8548175946"/>
                <box rightPadding="10">
                    <topPen lineWidth="0.5" lineStyle="Solid" lineColor="#000000"/>
                    <leftPen lineWidth="0.5" lineStyle="Solid" lineColor="#000000"/>
                    <bottomPen lineWidth="0.5" lineStyle="Solid" lineColor="#000000"/>
                    <rightPen lineWidth="0.5" lineStyle="Solid" lineColor="#000000"/>
                </box>
                <textElement textAlignment="Right" verticalAlignment="Middle">
                    <font size="12"/>
                </textElement>
                <textFieldExpression><![CDATA["0.05592538471251264"]]></textFieldExpression>
            </textField>
            <textField>
                <reportElement mode="Opaque" x="150" y="160" width="183" height="30" backcolor="#EFDAF7" uuid="6595f244-af18-4c15-aa98-95494397055b"/>
                <box rightPadding="10">
                    <topPen lineWidth="0.5" lineStyle="Solid" lineColor="#000000"/>
                    <leftPen lineWidth="0.5" lineStyle="Solid" lineColor="#000000"/>
                    <bottomPen lineWidth="0.5" lineStyle="Solid" lineColor="#000000"/>
                    <rightPen lineWidth="0.5" lineStyle="Solid" lineColor="#000000"/>
                </box>
                <textElement textAlignment="Right" verticalAlignment="Middle">
                    <font size="12"/>
                </textElement>
                <textFieldExpression><![CDATA[new BigDecimal(new Double(1.9596988841721044)).setScale(1, RoundingMode.DOWN)]]></textFieldExpression>
            </textField>
            <textField>
                <reportElement mode="Opaque" x="-1" y="160" width="151" height="30" backcolor="#EFDAF7" uuid="5088a6a2-d02c-4461-81e5-afeb3d0e667f"/>
                <box rightPadding="10">
                    <topPen lineWidth="0.5" lineStyle="Solid" lineColor="#000000"/>
                    <leftPen lineWidth="0.5" lineStyle="Solid" lineColor="#000000"/>
                    <bottomPen lineWidth="0.5" lineStyle="Solid" lineColor="#000000"/>
                    <rightPen lineWidth="0.5" lineStyle="Solid" lineColor="#000000"/>
                </box>
                <textElement textAlignment="Right" verticalAlignment="Middle">
                    <font size="12"/>
                </textElement>
                <textFieldExpression><![CDATA["1.9596988841721044"]]></textFieldExpression>
            </textField>
            <textField>
                <reportElement mode="Opaque" x="353" y="122" width="180" height="30" backcolor="#EFDAF7" uuid="7b137a50-3266-48e1-b6f6-5d96c706e7aa"/>
                <box rightPadding="10">
                    <topPen lineWidth="0.5" lineStyle="Solid" lineColor="#000000"/>
                    <leftPen lineWidth="0.5" lineStyle="Solid" lineColor="#000000"/>
                    <bottomPen lineWidth="0.5" lineStyle="Solid" lineColor="#000000"/>
                    <rightPen lineWidth="0.5" lineStyle="Solid" lineColor="#000000"/>
                </box>
                <textElement textAlignment="Right" verticalAlignment="Middle">
                    <font size="12"/>
                </textElement>
                <textFieldExpression><![CDATA["("+new BigDecimal(new Double(0.05592538471251264)).setScale(1, RoundingMode.DOWN) +"%"+")"]]></textFieldExpression>
            </textField>
            <textField>
                <reportElement mode="Opaque" x="352" y="161" width="183" height="30" backcolor="#EFDAF7" uuid="eb1c793d-be6b-4140-ab17-403e509b70a2"/>
                <box rightPadding="10">
                    <topPen lineWidth="0.5" lineStyle="Solid" lineColor="#000000"/>
                    <leftPen lineWidth="0.5" lineStyle="Solid" lineColor="#000000"/>
                    <bottomPen lineWidth="0.5" lineStyle="Solid" lineColor="#000000"/>
                    <rightPen lineWidth="0.5" lineStyle="Solid" lineColor="#000000"/>
                </box>
                <textElement textAlignment="Right" verticalAlignment="Middle">
                    <font size="12"/>
                </textElement>
                <textFieldExpression><![CDATA["("+new BigDecimal(new Double(1.9596988841721044)).setScale(1, RoundingMode.DOWN)+"%"+")"]]></textFieldExpression>
            </textField>
            <textField>
                <reportElement mode="Opaque" x="-1" y="203" width="154" height="30" backcolor="#EFDAF7" uuid="2be78c2f-121a-420f-840a-4053ca87699c"/>
                <box rightPadding="10">
                    <topPen lineWidth="0.5" lineStyle="Solid" lineColor="#000000"/>
                    <leftPen lineWidth="0.5" lineStyle="Solid" lineColor="#000000"/>
                    <bottomPen lineWidth="0.5" lineStyle="Solid" lineColor="#000000"/>
                    <rightPen lineWidth="0.5" lineStyle="Solid" lineColor="#000000"/>
                </box>
                <textElement textAlignment="Right" verticalAlignment="Middle">
                    <font size="12"/>
                </textElement>
                <textFieldExpression><![CDATA["91.0"]]></textFieldExpression>
            </textField>
            <textField>
                <reportElement mode="Opaque" x="355" y="204" width="183" height="30" backcolor="#EFDAF7" uuid="365e3fae-e19e-4f49-aa7a-020438455903"/>
                <box rightPadding="10">
                    <topPen lineWidth="0.5" lineStyle="Solid" lineColor="#000000"/>
                    <leftPen lineWidth="0.5" lineStyle="Solid" lineColor="#000000"/>
                    <bottomPen lineWidth="0.5" lineStyle="Solid" lineColor="#000000"/>
                    <rightPen lineWidth="0.5" lineStyle="Solid" lineColor="#000000"/>
                </box>
                <textElement textAlignment="Right" verticalAlignment="Middle">
                    <font size="12"/>
                </textElement>
                <textFieldExpression><![CDATA["("+new BigDecimal(new Double(91.0)).setScale(1, RoundingMode.DOWN)+"%"+")"]]></textFieldExpression>
            </textField>
            <textField>
                <reportElement mode="Opaque" x="153" y="203" width="183" height="30" backcolor="#EFDAF7" uuid="3ffc22a8-ce74-4780-a6ab-af43b9e1b10d"/>
                <box rightPadding="10">
                    <topPen lineWidth="0.5" lineStyle="Solid" lineColor="#000000"/>
                    <leftPen lineWidth="0.5" lineStyle="Solid" lineColor="#000000"/>
                    <bottomPen lineWidth="0.5" lineStyle="Solid" lineColor="#000000"/>
                    <rightPen lineWidth="0.5" lineStyle="Solid" lineColor="#000000"/>
                </box>
                <textElement textAlignment="Right" verticalAlignment="Middle">
                    <font size="12"/>
                </textElement>
                <textFieldExpression><![CDATA[new BigDecimal(new Double(91.0)).setScale(1, RoundingMode.DOWN)]]></textFieldExpression>
            </textField>
            <textField>
                <reportElement mode="Opaque" x="152" y="248" width="183" height="30" backcolor="#EFDAF7" uuid="c7450588-2e81-44a8-bff9-c96a7fa645dd"/>
                <box rightPadding="10">
                    <topPen lineWidth="0.5" lineStyle="Solid" lineColor="#000000"/>
                    <leftPen lineWidth="0.5" lineStyle="Solid" lineColor="#000000"/>
                    <bottomPen lineWidth="0.5" lineStyle="Solid" lineColor="#000000"/>
                    <rightPen lineWidth="0.5" lineStyle="Solid" lineColor="#000000"/>
                </box>
                <textElement textAlignment="Right" verticalAlignment="Middle">
                    <font size="12"/>
                </textElement>
                <textFieldExpression><![CDATA[new BigDecimal(new Double(.0)).setScale(1, RoundingMode.DOWN)]]></textFieldExpression>
            </textField>
            <textField>
                <reportElement mode="Opaque" x="354" y="249" width="183" height="30" backcolor="#EFDAF7" uuid="fb7c9922-230e-475c-afe1-1aa0b675097a"/>
                <box rightPadding="10">
                    <topPen lineWidth="0.5" lineStyle="Solid" lineColor="#000000"/>
                    <leftPen lineWidth="0.5" lineStyle="Solid" lineColor="#000000"/>
                    <bottomPen lineWidth="0.5" lineStyle="Solid" lineColor="#000000"/>
                    <rightPen lineWidth="0.5" lineStyle="Solid" lineColor="#000000"/>
                </box>
                <textElement textAlignment="Right" verticalAlignment="Middle">
                    <font size="12"/>
                </textElement>
                <textFieldExpression><![CDATA["("+new BigDecimal(new Double(.0)).setScale(1, RoundingMode.DOWN)+"%"+")"]]></textFieldExpression>
            </textField>
            <textField>
                <reportElement mode="Opaque" x="-1" y="248" width="153" height="30" backcolor="#EFDAF7" uuid="6d9ccc44-f198-499b-9385-c2d25bd2a46b"/>
                <box rightPadding="10">
                    <topPen lineWidth="0.5" lineStyle="Solid" lineColor="#000000"/>
                    <leftPen lineWidth="0.5" lineStyle="Solid" lineColor="#000000"/>
                    <bottomPen lineWidth="0.5" lineStyle="Solid" lineColor="#000000"/>
                    <rightPen lineWidth="0.5" lineStyle="Solid" lineColor="#000000"/>
                </box>
                <textElement textAlignment="Right" verticalAlignment="Middle">
                    <font size="12"/>
                </textElement>
                <textFieldExpression><![CDATA[".0"]]></textFieldExpression>
            </textField>
            <textField>
                <reportElement mode="Opaque" x="1" y="72" width="151" height="40" backcolor="#BFF2CF" uuid="a5f36874-8b7c-45cd-bd3b-f8cbe33c2418"/>
                <box rightPadding="10">
                    <topPen lineWidth="0.5" lineStyle="Solid" lineColor="#000000"/>
                    <leftPen lineWidth="0.5" lineStyle="Solid" lineColor="#000000"/>
                    <bottomPen lineWidth="0.5" lineStyle="Solid" lineColor="#000000"/>
                    <rightPen lineWidth="0.5" lineStyle="Solid" lineColor="#000000"/>
                </box>
                <textElement textAlignment="Right" verticalAlignment="Middle">
                    <font size="12"/>
                </textElement>
                <textFieldExpression><![CDATA["0.05592538471251264"+"\n"+"Using String format"]]></textFieldExpression>
            </textField>
            <textField>
                <reportElement mode="Opaque" x="353" y="72" width="180" height="40" backcolor="#BFF2CF" uuid="2f2688c8-b600-4acc-a069-7a22fe263ae8"/>
                <box rightPadding="10">
                    <topPen lineWidth="0.5" lineStyle="Solid" lineColor="#000000"/>
                    <leftPen lineWidth="0.5" lineStyle="Solid" lineColor="#000000"/>
                    <bottomPen lineWidth="0.5" lineStyle="Solid" lineColor="#000000"/>
                    <rightPen lineWidth="0.5" lineStyle="Solid" lineColor="#000000"/>
                </box>
                <textElement textAlignment="Right" verticalAlignment="Middle">
                    <font size="12"/>
                </textElement>
                <textFieldExpression><![CDATA["("+String.format("%.1f",0.05592538471251264) +"%"+")"]]></textFieldExpression>
            </textField>
            <textField>
                <reportElement mode="Opaque" x="0" y="21" width="555" height="30" backcolor="#E3E1E3" uuid="c103067c-da2e-4091-b18c-357aebf5e113"/>
                <box>
                    <topPen lineWidth="0.5" lineStyle="Solid" lineColor="#000000"/>
                    <leftPen lineWidth="0.5" lineStyle="Solid" lineColor="#000000"/>
                    <bottomPen lineWidth="0.5" lineStyle="Solid" lineColor="#000000"/>
                    <rightPen lineWidth="0.5" lineStyle="Solid" lineColor="#000000"/>
                </box>
                <textElement textAlignment="Center" verticalAlignment="Middle">
                    <font size="12" isBold="true"/>
                </textElement>
                <textFieldExpression><![CDATA["Display RoundingMode.DOWN values for Decimal Types in Jasper Reports"]]></textFieldExpression>
            </textField>
        </band>
    </title>
</jasperReport>


References : 
1) http://docs.oracle.com/javase/7/docs/api/java/math/BigDecimal.html
2) http://docs.oracle.com/javase/7/docs/api/java/math/RoundingMode.html

Use Case : Usage of two or more different data sources in Single Report

Hi Folks,

 (Theory will update here later tomorrow or so, meanwhile use the JRXML to view the output)

Data bases used : 
1) MySQL , sakila db
2) PostgreSQL foodmart db.
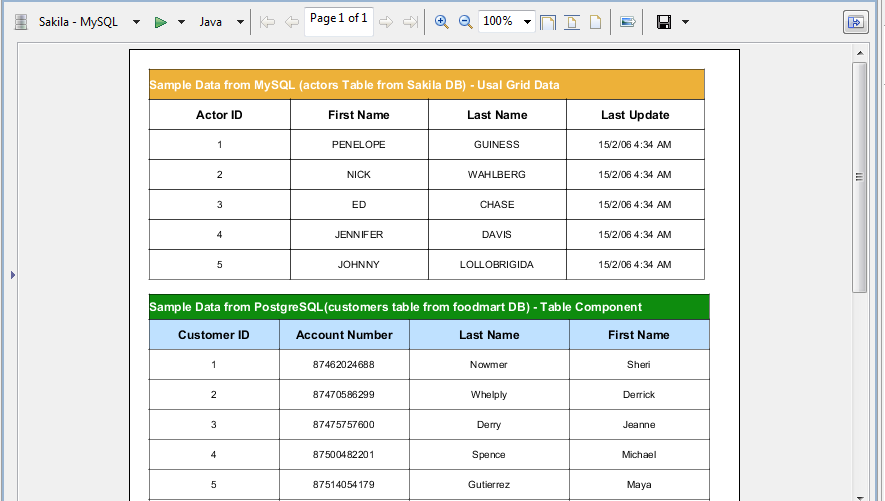
Sample output


Copy paste this code in your JRXML source code and observe the "Dataset1" data source parameters and connections as well the main report query and its connection.

<?xml version="1.0" encoding="UTF-8"?>
<!-- Created with Jaspersoft Studio version 6.1.0.final using JasperReports Library version 6.1.0  -->
<!-- 2015-12-16T00:19:39 -->
<jasperReport xmlns="http://jasperreports.sourceforge.net/jasperreports" xmlns:xsi="http://www.w3.org/2001/XMLSchema-instance" xsi:schemaLocation="http://jasperreports.sourceforge.net/jasperreports http://jasperreports.sourceforge.net/xsd/jasperreport.xsd" name="MyFirst Report" pageWidth="610" pageHeight="842" columnWidth="570" leftMargin="20" rightMargin="20" topMargin="20" bottomMargin="20" uuid="295ab2d1-1932-4c33-823a-b088e233383f">
    <property name="com.jaspersoft.studio.data.defaultdataadapter" value="Sakila - MySQL"/>
    <property name="com.jaspersoft.studio.unit." value="pixel"/>
    <property name="com.jaspersoft.studio.unit.pageHeight" value="pixel"/>
    <property name="com.jaspersoft.studio.unit.pageWidth" value="pixel"/>
    <property name="com.jaspersoft.studio.unit.topMargin" value="pixel"/>
    <property name="com.jaspersoft.studio.unit.bottomMargin" value="pixel"/>
    <property name="com.jaspersoft.studio.unit.leftMargin" value="pixel"/>
    <property name="com.jaspersoft.studio.unit.rightMargin" value="pixel"/>
    <property name="com.jaspersoft.studio.unit.columnWidth" value="pixel"/>
    <property name="com.jaspersoft.studio.unit.columnSpacing" value="pixel"/>
    <style name="Table_TH" mode="Opaque" backcolor="#F0F8FF">
        <box>
            <pen lineWidth="0.5" lineColor="#000000"/>
            <topPen lineWidth="0.5" lineColor="#000000"/>
            <leftPen lineWidth="0.5" lineColor="#000000"/>
            <bottomPen lineWidth="0.5" lineColor="#000000"/>
            <rightPen lineWidth="0.5" lineColor="#000000"/>
        </box>
    </style>
    <style name="Table_CH" mode="Opaque" backcolor="#BFE1FF">
        <box>
            <pen lineWidth="0.5" lineColor="#000000"/>
            <topPen lineWidth="0.5" lineColor="#000000"/>
            <leftPen lineWidth="0.5" lineColor="#000000"/>
            <bottomPen lineWidth="0.5" lineColor="#000000"/>
            <rightPen lineWidth="0.5" lineColor="#000000"/>
        </box>
    </style>
    <style name="Table_TD" mode="Opaque" backcolor="#FFFFFF">
        <box>
            <pen lineWidth="0.5" lineColor="#000000"/>
            <topPen lineWidth="0.5" lineColor="#000000"/>
            <leftPen lineWidth="0.5" lineColor="#000000"/>
            <bottomPen lineWidth="0.5" lineColor="#000000"/>
            <rightPen lineWidth="0.5" lineColor="#000000"/>
        </box>
    </style>
    <style name="Table 1_TH" mode="Opaque" backcolor="#F0F8FF">
        <box>
            <pen lineWidth="0.5" lineColor="#000000"/>
            <topPen lineWidth="0.5" lineColor="#000000"/>
            <leftPen lineWidth="0.5" lineColor="#000000"/>
            <bottomPen lineWidth="0.5" lineColor="#000000"/>
            <rightPen lineWidth="0.5" lineColor="#000000"/>
        </box>
    </style>
    <style name="Table 1_CH" mode="Opaque" backcolor="#BFE1FF">
        <box>
            <pen lineWidth="0.5" lineColor="#000000"/>
            <topPen lineWidth="0.5" lineColor="#000000"/>
            <leftPen lineWidth="0.5" lineColor="#000000"/>
            <bottomPen lineWidth="0.5" lineColor="#000000"/>
            <rightPen lineWidth="0.5" lineColor="#000000"/>
        </box>
    </style>
    <style name="Table 1_TD" mode="Opaque" backcolor="#FFFFFF">
        <box>
            <pen lineWidth="0.5" lineColor="#000000"/>
            <topPen lineWidth="0.5" lineColor="#000000"/>
            <leftPen lineWidth="0.5" lineColor="#000000"/>
            <bottomPen lineWidth="0.5" lineColor="#000000"/>
            <rightPen lineWidth="0.5" lineColor="#000000"/>
        </box>
    </style>
    <subDataset name="Dataset1" uuid="d0d375a4-ddad-4353-8013-29dd8f924ee6">
        <property name="com.jaspersoft.studio.data.defaultdataadapter" value="foodmart"/>
        <queryString>
            <![CDATA[select * from customer  limit 10]]>
        </queryString>
        <field name="customer_id" class="java.lang.Integer"/>
        <field name="account_num" class="java.lang.Long"/>
        <field name="lname" class="java.lang.String"/>
        <field name="fname" class="java.lang.String"/>
    </subDataset>
    <parameter name="Parameter1" class="java.sql.Connection">
        <defaultValueExpression><![CDATA[java.sql.DriverManager.getConnection("jdbc:postgresql://localhost:5432/foodmart","postgres","postgres")]]></defaultValueExpression>
    </parameter>
    <queryString>
        <![CDATA[select * from actor limit 5]]>
    </queryString>
    <field name="actor_id" class="java.lang.Integer">
        <fieldDescription><![CDATA[]]></fieldDescription>
    </field>
    <field name="first_name" class="java.lang.String">
        <fieldDescription><![CDATA[]]></fieldDescription>
    </field>
    <field name="last_name" class="java.lang.String">
        <fieldDescription><![CDATA[]]></fieldDescription>
    </field>
    <field name="last_update" class="java.sql.Timestamp">
        <fieldDescription><![CDATA[]]></fieldDescription>
    </field>
    <title>
        <band height="30">
            <textField>
                <reportElement mode="Opaque" x="0" y="0" width="555" height="30" forecolor="#FFFFFF" backcolor="#140AA6" uuid="b7e23fc2-6761-4e4c-9d81-3ed743736088"/>
                <box>
                    <topPen lineWidth="0.5" lineStyle="Solid" lineColor="#000000"/>
                    <leftPen lineWidth="0.5" lineStyle="Solid" lineColor="#000000"/>
                    <bottomPen lineWidth="0.5" lineStyle="Solid" lineColor="#000000"/>
                    <rightPen lineWidth="0.5" lineStyle="Solid" lineColor="#000000"/>
                </box>
                <textElement textAlignment="Left" verticalAlignment="Middle">
                    <font size="12" isBold="true"/>
                </textElement>
                <textFieldExpression><![CDATA["Sample Data from MySQL (actors Table from Sakila DB) - Usal Grid Data"]]></textFieldExpression>
            </textField>
        </band>
    </title>
    <columnHeader>
        <band height="30">
            <staticText>
                <reportElement x="0" y="0" width="141" height="30" uuid="3eb6afeb-84ce-43ec-89bb-12deef6ea8cc"/>
                <box>
                    <topPen lineWidth="0.5" lineStyle="Solid" lineColor="#000000"/>
                    <leftPen lineWidth="0.5" lineStyle="Solid" lineColor="#000000"/>
                    <bottomPen lineWidth="0.5" lineStyle="Solid" lineColor="#000000"/>
                    <rightPen lineWidth="0.5" lineStyle="Solid" lineColor="#000000"/>
                </box>
                <textElement textAlignment="Center" verticalAlignment="Middle">
                    <font size="12" isBold="true"/>
                </textElement>
                <text><![CDATA[Actor ID]]></text>
            </staticText>
            <staticText>
                <reportElement x="141" y="0" width="138" height="30" uuid="0447724f-01b9-467b-b63d-1cc3b32f21d9"/>
                <box>
                    <topPen lineWidth="0.5" lineStyle="Solid" lineColor="#000000"/>
                    <leftPen lineWidth="0.5" lineStyle="Solid" lineColor="#000000"/>
                    <bottomPen lineWidth="0.5" lineStyle="Solid" lineColor="#000000"/>
                    <rightPen lineWidth="0.5" lineStyle="Solid" lineColor="#000000"/>
                </box>
                <textElement textAlignment="Center" verticalAlignment="Middle">
                    <font size="12" isBold="true"/>
                </textElement>
                <text><![CDATA[First Name]]></text>
            </staticText>
            <staticText>
                <reportElement x="279" y="0" width="138" height="30" uuid="b6cb62b5-ca07-4059-b336-0d7bbc9c144d"/>
                <box>
                    <topPen lineWidth="0.5" lineStyle="Solid" lineColor="#000000"/>
                    <leftPen lineWidth="0.5" lineStyle="Solid" lineColor="#000000"/>
                    <bottomPen lineWidth="0.5" lineStyle="Solid" lineColor="#000000"/>
                    <rightPen lineWidth="0.5" lineStyle="Solid" lineColor="#000000"/>
                </box>
                <textElement textAlignment="Center" verticalAlignment="Middle">
                    <font size="12" isBold="true"/>
                </textElement>
                <text><![CDATA[Last Name]]></text>
            </staticText>
            <staticText>
                <reportElement x="417" y="0" width="138" height="30" uuid="f8e0ace8-5bda-4a21-8b6a-59a5ced2ab28"/>
                <box>
                    <topPen lineWidth="0.5" lineStyle="Solid" lineColor="#000000"/>
                    <leftPen lineWidth="0.5" lineStyle="Solid" lineColor="#000000"/>
                    <bottomPen lineWidth="0.5" lineStyle="Solid" lineColor="#000000"/>
                    <rightPen lineWidth="0.5" lineStyle="Solid" lineColor="#000000"/>
                </box>
                <textElement textAlignment="Center" verticalAlignment="Middle">
                    <font size="12" isBold="true"/>
                </textElement>
                <text><![CDATA[Last Update]]></text>
            </staticText>
        </band>
    </columnHeader>
    <detail>
        <band height="30">
            <textField>
                <reportElement x="0" y="0" width="141" height="30" uuid="1cc25a45-7e39-45d5-ba5a-d0fd7002f754"/>
                <box>
                    <topPen lineWidth="0.5" lineStyle="Solid" lineColor="#000000"/>
                    <leftPen lineWidth="0.5" lineStyle="Solid" lineColor="#000000"/>
                    <bottomPen lineWidth="0.5" lineStyle="Solid" lineColor="#000000"/>
                    <rightPen lineWidth="0.5" lineStyle="Solid" lineColor="#000000"/>
                </box>
                <textElement textAlignment="Center" verticalAlignment="Middle"/>
                <textFieldExpression><![CDATA[$F{actor_id}]]></textFieldExpression>
            </textField>
            <textField>
                <reportElement x="141" y="0" width="138" height="30" uuid="dac36d6a-dd6e-4733-b8a6-377fd5bceb81"/>
                <box>
                    <topPen lineWidth="0.5" lineStyle="Solid" lineColor="#000000"/>
                    <leftPen lineWidth="0.5" lineStyle="Solid" lineColor="#000000"/>
                    <bottomPen lineWidth="0.5" lineStyle="Solid" lineColor="#000000"/>
                    <rightPen lineWidth="0.5" lineStyle="Solid" lineColor="#000000"/>
                </box>
                <textElement textAlignment="Center" verticalAlignment="Middle"/>
                <textFieldExpression><![CDATA[$F{first_name}]]></textFieldExpression>
            </textField>
            <textField>
                <reportElement x="279" y="0" width="138" height="30" uuid="02859075-ae5d-4c2e-8a83-09fe29abb34c"/>
                <box>
                    <topPen lineWidth="0.5" lineStyle="Solid" lineColor="#000000"/>
                    <leftPen lineWidth="0.5" lineStyle="Solid" lineColor="#000000"/>
                    <bottomPen lineWidth="0.5" lineStyle="Solid" lineColor="#000000"/>
                    <rightPen lineWidth="0.5" lineStyle="Solid" lineColor="#000000"/>
                </box>
                <textElement textAlignment="Center" verticalAlignment="Middle"/>
                <textFieldExpression><![CDATA[$F{last_name}]]></textFieldExpression>
            </textField>
            <textField>
                <reportElement x="417" y="0" width="138" height="30" uuid="bffb90ed-fc35-41b4-a39b-fe28af23e307"/>
                <box>
                    <topPen lineWidth="0.5" lineStyle="Solid" lineColor="#000000"/>
                    <leftPen lineWidth="0.5" lineStyle="Solid" lineColor="#000000"/>
                    <bottomPen lineWidth="0.5" lineStyle="Solid" lineColor="#000000"/>
                    <rightPen lineWidth="0.5" lineStyle="Solid" lineColor="#000000"/>
                </box>
                <textElement textAlignment="Center" verticalAlignment="Middle"/>
                <textFieldExpression><![CDATA[$F{last_update}]]></textFieldExpression>
            </textField>
        </band>
    </detail>
    <summary>
        <band height="100" splitType="Stretch">
            <componentElement>
                <reportElement x="0" y="40" width="560" height="60" uuid="fdcac2e9-0944-42ed-bf44-7b73595775bf"/>
                <jr:table xmlns:jr="http://jasperreports.sourceforge.net/jasperreports/components" xsi:schemaLocation="http://jasperreports.sourceforge.net/jasperreports/components http://jasperreports.sourceforge.net/xsd/components.xsd">
                    <datasetRun subDataset="Dataset1" uuid="70bb99c8-d50e-43df-a7da-9c4ad8b50ac8">
                        <datasetParameter name="REPORT_CONNECTION">
                            <datasetParameterExpression><![CDATA[java.sql.DriverManager.getConnection("jdbc:postgresql://localhost:5432/foodmart","postgres","postgres")]]></datasetParameterExpression>
                        </datasetParameter>
                    </datasetRun>
                    <jr:column width="130" uuid="b05aaed5-3d79-4bde-877e-c27574732176">
                        <jr:columnHeader style="Table 1_CH" height="30">
                            <staticText>
                                <reportElement x="0" y="0" width="130" height="30" uuid="b06296b3-25a3-4ab5-8e07-8bb87252e358"/>
                                <textElement textAlignment="Center" verticalAlignment="Middle">
                                    <font size="12" isBold="true"/>
                                </textElement>
                                <text><![CDATA[Customer ID]]></text>
                            </staticText>
                        </jr:columnHeader>
                        <jr:detailCell style="Table 1_TD" height="30">
                            <textField>
                                <reportElement x="0" y="0" width="130" height="30" uuid="491cf206-6da6-4935-9583-1bcd01b054ed"/>
                                <textElement textAlignment="Center" verticalAlignment="Middle"/>
                                <textFieldExpression><![CDATA[$F{customer_id}]]></textFieldExpression>
                            </textField>
                        </jr:detailCell>
                    </jr:column>
                    <jr:column width="130" uuid="0e829c3e-9ce9-413c-b7f7-5c422600915c">
                        <jr:columnHeader style="Table 1_CH" height="30">
                            <staticText>
                                <reportElement x="0" y="0" width="130" height="30" uuid="e562ec15-d83d-4d24-ad05-8f9089e00417"/>
                                <textElement textAlignment="Center" verticalAlignment="Middle">
                                    <font size="12" isBold="true"/>
                                </textElement>
                                <text><![CDATA[Account Number]]></text>
                            </staticText>
                        </jr:columnHeader>
                        <jr:detailCell style="Table 1_TD" height="30">
                            <textField>
                                <reportElement x="0" y="0" width="130" height="30" uuid="9f092a95-c914-4cb3-833a-0533262218e8"/>
                                <textElement textAlignment="Center" verticalAlignment="Middle"/>
                                <textFieldExpression><![CDATA[$F{account_num}]]></textFieldExpression>
                            </textField>
                        </jr:detailCell>
                    </jr:column>
                    <jr:column width="160" uuid="d6835cd4-c0c8-4572-9c1f-69757dae0058">
                        <jr:columnHeader style="Table 1_CH" height="30">
                            <staticText>
                                <reportElement x="0" y="0" width="160" height="30" uuid="9740787e-699e-4bf6-afdb-8a42a9be401f"/>
                                <textElement textAlignment="Center" verticalAlignment="Middle">
                                    <font size="12" isBold="true"/>
                                </textElement>
                                <text><![CDATA[Last Name]]></text>
                            </staticText>
                        </jr:columnHeader>
                        <jr:detailCell style="Table 1_TD" height="30">
                            <textField>
                                <reportElement x="0" y="0" width="160" height="30" uuid="aa773812-1211-458d-9db9-d6a2158b15d5"/>
                                <textElement textAlignment="Center" verticalAlignment="Middle"/>
                                <textFieldExpression><![CDATA[$F{lname}]]></textFieldExpression>
                            </textField>
                        </jr:detailCell>
                    </jr:column>
                    <jr:column width="140" uuid="66e70e1b-089b-4f37-abca-177c15501335">
                        <jr:columnHeader style="Table 1_CH" height="30">
                            <staticText>
                                <reportElement x="0" y="0" width="140" height="30" uuid="6ad992bd-f73d-4d76-a641-e2b5c020f178"/>
                                <textElement textAlignment="Center" verticalAlignment="Middle">
                                    <font size="12" isBold="true"/>
                                </textElement>
                                <text><![CDATA[First Name]]></text>
                            </staticText>
                        </jr:columnHeader>
                        <jr:detailCell style="Table 1_TD" height="30">
                            <textField>
                                <reportElement x="0" y="0" width="140" height="30" uuid="490c9352-0017-47ba-a35d-03264e28682c"/>
                                <textElement textAlignment="Center" verticalAlignment="Middle"/>
                                <textFieldExpression><![CDATA[$F{fname}]]></textFieldExpression>
                            </textField>
                        </jr:detailCell>
                    </jr:column>
                </jr:table>
            </componentElement>
            <textField>
                <reportElement mode="Opaque" x="0" y="15" width="560" height="25" forecolor="#FFFFFF" backcolor="#140AA6" uuid="e04d653c-7197-4ffe-8078-c70d101190b4">
                    <property name="com.jaspersoft.studio.unit.height" value="pixel"/>
                </reportElement>
                <box>
                    <topPen lineWidth="0.5" lineStyle="Solid" lineColor="#000000"/>
                    <leftPen lineWidth="0.5" lineStyle="Solid" lineColor="#000000"/>
                    <bottomPen lineWidth="0.5" lineStyle="Solid" lineColor="#000000"/>
                    <rightPen lineWidth="0.5" lineStyle="Solid" lineColor="#000000"/>
                </box>
                <textElement textAlignment="Left" verticalAlignment="Middle">
                    <font size="12" isBold="true"/>
                </textElement>
                <textFieldExpression><![CDATA["Sample Data from PostgreSQL(customers table from foodmart DB) - Table Component"]]></textFieldExpression>
            </textField>
        </band>
    </summary>
</jasperReport>


How to get the same output in the Jasper Server ? 
By creating Virtual Data source defined in Jasper Server and pointing out the report to use this data source.

NOTE : Virtual Data source concept is an enterprise feature in Jaspersoft BI. 

References : 
http://community.jaspersoft.com/wiki/multiple-datasources-ireport-lists-tables-and-subreports
http://community.jaspersoft.com/wiki/connecting-jasperreports-server-your-database


Scriptlet Example in Jaspersoft 6.x for begineers - Hello World Sample Example

Hi Folks,
This tutorial talks about step by step procedure to write a custom Scriptlet in Jasper Design Studio

Environment : 
Jasper Design Studio 6.2 Professional ,
Eclipse Mars.1 Release (4.5.1)

Aim of the tutorial : Print "Hello..." information on summary band. 
1) Choose your Java Editor 
        (I have taken Eclipse for this tutorial user friendly for Eclipse
            - Netbeans is developer friendly for iReport Designer)

2) Create Java Project 
     File -> New -> Project -> Java Project -> Give Project Name as "Test"

3) Add Jasper Server jar file to Project Path
Right click on Project Name -> Build Path ->Configure Build Path -> Libraries -> Add External Jar Files -> Locate the jar file from below location -> Click on Apply -> OK
   Location of Jar File : 
      C:\Jaspersoft\jasperreports-server-6.2.0\apache-tomcat\webapps\jasperserver-pro\WEB-INF\lib
   Jar File Name : jasperreports-pro-6.0.0.jar

4)  Create a Package & a Class inside it with your business logic

Package name is : com.sadakar.jasper
Class Name is : Test4

package com.sadakar.jasper;
import net.sf.jasperreports.engine.JRDefaultScriptlet;
import net.sf.jasperreports.engine.JRScriptletException;

public class Test4 extends JRDefaultScriptlet{

    public String hello() throws JRScriptletException
    {
        return "Hello! I'm the report's scriptlet object.";
    }
}


NOTE :
 Scriplets can be written using  JRDefaultScriptlet  and  JRAbstractScriptlet
The current example is a user defined scriptlet hence it should import JRDefaultScriptlet
More information can be found at : http://jasperreports.sourceforge.net/sample.reference/scriptlet/

We can not run  the class as Java Application. To run it as a Java Application it requires main() method.

5) Make the Project as Jar File (Export the project as a Jar File)
Right click on the "Test" Project -> Export -> Java (JAR File). 
 I have given jar file name as "test"

6) Make use of Custom Java Code from the exported Jar File in Studio  - How ?  

a) Put the Jar in Studio Project Path 
   Right Click on "My Reports" Project -> Build Path -> Configure Build Path -> Libraries -> Add External Libraries ->("test" jar from your exported location from Eclipse) ->

b) Creating a sample JRXML to test the hello() method from the JAVA Code
     i) Create a JRXML
     ii) Remove unnecessary bands
     iii) Go to "Scriptlets" section from "Outline" window
     iv) Right Click on "Scriplets" and then  click on "Create Scriptlet"
     v) Give Name="Hello" and Class="com.sadakar.jasper.Test4"  (with out double quotes).
     vi) Observe that as quick as you create Scriptlet, Jasper Studio engine creates a parameter
           in  "Parameters" node. Here it will create "Hello_SCRIPTLET"
     vi) Now, call the hello() method anywhere in the report
           Drag a "Text Filed" to the summary and write this expression
                                            $P{Hello_SCRIPTLET}.hello()


 NOTE : If you don't use any data source to the report select No Data Type = "All sections No Detail" to the report in its properties

 7) Save , Compile and run the report. 


Download Examples : 
JRXML+JAR File + Complete Eclipse Project 

I hope this helps some one to get start with scriptlets in jasper

References : 
http://jasperreports.sourceforge.net/sample.reference/scriptlet/
http://blog.sacaluta.com/2007/07/jasperreports-scriptlet-example.html

StackedColumnLine or StackedColumn..SpLine highcharts example in Jasper Design Studio 6.x or later

Hi Folks,

This tutorial will talk about how to work with StackedCoulumnLine or StackedColumn..SpLine

Software used for this example
1) Jasper Design Studio 6.2 Professional
2) Jasper Server 6.2 Professional
3) PostgreSQL foodmart database

Chart engine implementations vary from tool to tool to visualize data on graphs hence we have to build our result set from querying technologies to adapt it by the graph.


Core parts:

Query Format : 
In jasper your query format for dual axis (Stacked bar + Line) should take below query format. 
i.e., the chart will take 3 measures . In this example I have taken 2 measures and caluculated 3rd mesure as profit by using first 2 measures.

 Graph to pull on Designer
  Drag and drop the StackedColumnLine or StackedCo..Spline chart and give chart data properties as shown in below two images. 
 

Chart Properties to Set :

Sample output in the server : 
Publish it the server and view the output. Sample output will look as shown in below image. 
 JRXML : 

<?xml version="1.0" encoding="UTF-8"?>
<!-- Created with Jaspersoft Studio version 6.2.0.final using JasperReports Library version 6.2.0  -->
<!-- 2016-01-14T14:36:04 -->
<jasperReport xmlns="http://jasperreports.sourceforge.net/jasperreports" xmlns:xsi="http://www.w3.org/2001/XMLSchema-instance" xsi:schemaLocation="http://jasperreports.sourceforge.net/jasperreports http://jasperreports.sourceforge.net/xsd/jasperreport.xsd" name="Blank_A4_3" pageWidth="595" pageHeight="842" columnWidth="555" leftMargin="20" rightMargin="20" topMargin="20" bottomMargin="20" uuid="3a9c4e03-faeb-4a1e-b0b6-4eb2dcdd5af0">
    <property name="com.jaspersoft.studio.data.defaultdataadapter" value="foodmart"/>
    <property name="com.jaspersoft.studio.data.sql.tables" value=""/>
    <property name="ireport.jasperserver.url" value="http://localhost:8081/jasperserver-pro/"/>
    <property name="ireport.jasperserver.user" value="superuser"/>
    <property name="ireport.jasperserver.reportUnit" value="/Explore/Reports/Stacked_Bar_with_Line_Sample"/>
    <property name="ireport.jasperserver.report.resource" value="/Explore/Reports/Stacked_Bar_with_Line_Sample_files/main_jrxml"/>
    <queryString>
        <![CDATA[SELECT DISTINCT c.occupation,t.the_month,t.month_of_year,sum(sf7.store_sales) store_sales,sum(sf7.unit_sales) unit_sales FROM customer c
INNER JOIN sales_fact_1997 sf7 ON c.customer_id=sf7.customer_id
INNER JOIN time_by_day t ON t.time_id=sf7.time_id
WHERE t.the_year=2012
GROUP BY c.occupation,t.the_month,t.month_of_year
ORDER BY t.month_of_year]]>
    </queryString>
    <field name="occupation" class="java.lang.String"/>
    <field name="the_month" class="java.lang.String"/>
    <field name="month_of_year" class="java.lang.Integer"/>
    <field name="store_sales" class="java.math.BigDecimal"/>
    <field name="unit_sales" class="java.math.BigDecimal"/>
    <title>
        <band height="50"/>
    </title>
    <summary>
        <band height="314" splitType="Stretch">
            <componentElement>
                <reportElement x="0" y="0" width="555" height="314" uuid="6dd6cf77-5197-46b5-9691-8fd27d40b95d"/>
                <hc:chart xmlns:hc="http://jaspersoft.com/highcharts" xsi:schemaLocation="http://jaspersoft.com/highcharts http://jaspersoft.com/schema/highcharts.xsd" type="StackedColumnLine">
                    <hc:chartSetting name="default">
                        <hc:chartProperty name="chart.zoomType">
                            <hc:propertyExpression><![CDATA["xy"]]></hc:propertyExpression>
                        </hc:chartProperty>
                        <hc:chartProperty name="credits.enabled">
                            <hc:propertyExpression><![CDATA[false]]></hc:propertyExpression>
                        </hc:chartProperty>
                        <hc:chartProperty name="credits.href">
                            <hc:propertyExpression><![CDATA[""]]></hc:propertyExpression>
                        </hc:chartProperty>
                        <hc:chartProperty name="credits.text">
                            <hc:propertyExpression><![CDATA[""]]></hc:propertyExpression>
                        </hc:chartProperty>
                        <hc:chartProperty name="title.text">
                            <hc:propertyExpression><![CDATA[""]]></hc:propertyExpression>
                        </hc:chartProperty>
                        <hc:chartProperty name="yAxis.title.text">
                            <hc:propertyExpression><![CDATA[""]]></hc:propertyExpression>
                        </hc:chartProperty>
                    </hc:chartSetting>
                    <multiAxisData>
                        <multiAxisDataset/>
                        <dataAxis axis="Rows">
                            <axisLevel name="Month">
                                <labelExpression><![CDATA["Level Label expression"]]></labelExpression>
                                <axisLevelBucket order="None" class="java.lang.String">
                                    <bucketExpression><![CDATA[$F{the_month}]]></bucketExpression>
                                </axisLevelBucket>
                            </axisLevel>
                        </dataAxis>
                        <dataAxis axis="Columns"/>
                        <multiAxisMeasure name="Store Sales" class="java.lang.Integer" calculation="Nothing">
                            <labelExpression><![CDATA["Store Sales"]]></labelExpression>
                            <valueExpression><![CDATA[$F{store_sales}]]></valueExpression>
                        </multiAxisMeasure>
                        <multiAxisMeasure name="Unit Sales" class="java.lang.Integer" calculation="Nothing">
                            <labelExpression><![CDATA["Unit Sales"]]></labelExpression>
                            <valueExpression><![CDATA[$F{unit_sales}]]></valueExpression>
                        </multiAxisMeasure>
                        <multiAxisMeasure name="Profit" class="java.lang.Integer" calculation="Nothing">
                            <labelExpression><![CDATA["Profit"]]></labelExpression>
                            <valueExpression><![CDATA[$F{store_sales}.intValue() -$F{unit_sales}.intValue()]]></valueExpression>
                        </multiAxisMeasure>
                    </multiAxisData>
                    <hc:series name="Store Sales"/>
                    <hc:series name="Unit Sales"/>
                    <hc:series name="Profit"/>
                </hc:chart>
            </componentElement>
        </band>
    </summary>
</jasperReport>
 

Playing with Advanced Properties of Dual Axis high Chart in Japser Studio 6.x or later - How to control Y axes values (min or max or common zero)

Hi Folks,

In my previous post, I wrote on how to work with StackedColumn..Line high chart in Jasper Studio 6.x. which you can find it  here 

This post is an extension of above example and gives you the tips for below points.

Example tested on :
1) Jasper Design Studio 6.2 & Server 6.2 - both are Professional editions.
2) foodmart database - PostgreSQL server. 

Problem Statement : 
How to set min and max values for Y1-axis and Y2-axis ? (Or)
How to tell Y2-axis to use the same values of Y1-axis ?  (Or)
How to tell both the axes to start with a common value ( a start point of zero) ?

You will find only the core part for this. 

1) Right Click on Chart (StackedColumn..Line)
2) Right bottom corner click on "Show Advanced Properties" 
3) Among the 3 tabs be in "Chart Properties" tab and inside it click "Context Specific" tab. 


4)  As shown in above image, click on "Add" button and below mentioned properties 
 Y1-Axis Properties (Default Axis for Dual Axis Chart)
# Name = yAxis
# Bydefault _jrAxisIndex attribute populates, and default value is 0
(If you have multiple axes you should give different default value say 1 or 2 or 3 for Y-axis2, Y-axis3, Y-axis4 repsectively).
 # This axis will take a mandatory property which would be used to identify the axis - later in the chart in some other place(Will discuss in next point)
   id="id0"
# Give properties like min, max, title.text and etc taking from HighCharts API. 
    High Charts API reference : http://api.highcharts.com/highcharts#yAxis


5) Repeat point-4 for second Y-axis (i.e., Y2-Axis) 
 The property linkedTo=0 will link axis values  properties from Y1-axis to Y2-Axis.

6) Go to each measure from configuration and click on modify to add advanced properties 

Measure 1: Store Sales
Contributor= SeriesProperty
Name=yAxis
Use constant Value =id0 (with out double quotes).

Do the same for remaining measures

Measure 2: Unit Sales
Contributor= SeriesProperty
Name=yAxis
Use constant Value =id0 (with out double quotes).

Measure 3:
Contributor= SeriesProperty
Name=yAxis
Use constant Value =id1 (with out double quotes).


Sample output (With the above explained properties). 

JRXML : 
<?xml version="1.0" encoding="UTF-8"?>
<!-- Created with Jaspersoft Studio version 6.2.0.final using JasperReports Library version 6.2.0  -->
<!-- 2016-01-19T18:18:11 -->
<jasperReport xmlns="http://jasperreports.sourceforge.net/jasperreports" xmlns:xsi="http://www.w3.org/2001/XMLSchema-instance" xsi:schemaLocation="http://jasperreports.sourceforge.net/jasperreports http://jasperreports.sourceforge.net/xsd/jasperreport.xsd" name="Blank_A4_3" pageWidth="700" pageHeight="842" columnWidth="660" leftMargin="20" rightMargin="20" topMargin="20" bottomMargin="20" uuid="3a9c4e03-faeb-4a1e-b0b6-4eb2dcdd5af0">
    <property name="com.jaspersoft.studio.data.defaultdataadapter" value="foodmart"/>
    <property name="com.jaspersoft.studio.data.sql.tables" value=""/>
    <property name="ireport.jasperserver.url" value="http://localhost:8081/jasperserver-pro/"/>
    <property name="ireport.jasperserver.user" value="superuser"/>
    <property name="ireport.jasperserver.reportUnit" value="/Explore/Stacked_Bar_with_Line_Sample"/>
    <property name="ireport.jasperserver.report.resource" value="/Explore/Stacked_Bar_with_Line_Sample_files/main_jrxml"/>
    <property name="com.jaspersoft.studio.unit." value="pixel"/>
    <queryString>
        <![CDATA[SELECT DISTINCT c.occupation,t.the_month,t.month_of_year,sum(sf7.store_sales) store_sales,sum(sf7.unit_sales) unit_sales FROM customer c
INNER JOIN sales_fact_1997 sf7 ON c.customer_id=sf7.customer_id
INNER JOIN time_by_day t ON t.time_id=sf7.time_id
WHERE t.the_year=2012
GROUP BY c.occupation,t.the_month,t.month_of_year
ORDER BY t.month_of_year]]>
    </queryString>
    <field name="occupation" class="java.lang.String"/>
    <field name="the_month" class="java.lang.String"/>
    <field name="month_of_year" class="java.lang.Integer"/>
    <field name="store_sales" class="java.math.BigDecimal"/>
    <field name="unit_sales" class="java.math.BigDecimal"/>
    <title>
        <band height="50"/>
    </title>
    <summary>
        <band height="449" splitType="Stretch">
            <componentElement>
                <reportElement x="0" y="0" width="660" height="449" uuid="6dd6cf77-5197-46b5-9691-8fd27d40b95d"/>
                <hc:chart xmlns:hc="http://jaspersoft.com/highcharts" xsi:schemaLocation="http://jaspersoft.com/highcharts http://jaspersoft.com/schema/highcharts.xsd" type="StackedColumnLine">
                    <hc:chartSetting name="default">
                        <hc:chartProperty name="chart.zoomType">
                            <hc:propertyExpression><![CDATA["xy"]]></hc:propertyExpression>
                        </hc:chartProperty>
                        <hc:chartProperty name="colors">
                            <hc:propertyExpression><![CDATA[java.util.Arrays.asList("#7cb5ec","#434348","#FF0000","#f7a35c","#8085e9","#f15c80","#e4d354","#2b908f","#f45b5b","#91e8e1")]]></hc:propertyExpression>
                        </hc:chartProperty>
                        <hc:chartProperty name="credits.enabled">
                            <hc:propertyExpression><![CDATA[false]]></hc:propertyExpression>
                        </hc:chartProperty>
                        <hc:chartProperty name="credits.href">
                            <hc:propertyExpression><![CDATA[""]]></hc:propertyExpression>
                        </hc:chartProperty>
                        <hc:chartProperty name="credits.text">
                            <hc:propertyExpression><![CDATA[""]]></hc:propertyExpression>
                        </hc:chartProperty>
                        <hc:chartProperty name="plotOptions.series.allowPointSelect">
                            <hc:propertyExpression><![CDATA[Boolean.TRUE]]></hc:propertyExpression>
                        </hc:chartProperty>
                        <hc:chartProperty name="plotOptions.series.dashStyle">
                            <hc:propertyExpression><![CDATA["Dash"]]></hc:propertyExpression>
                        </hc:chartProperty>
                        <hc:chartProperty name="title.text">
                            <hc:propertyExpression><![CDATA["Stacked Column and Line - Dual Axis Chart"]]></hc:propertyExpression>
                        </hc:chartProperty>
                    </hc:chartSetting>
                    <hc:chartSetting name="yAxis">
                        <hc:chartProperty name="_jrAxisIndex">
                            <hc:propertyExpression><![CDATA[1]]></hc:propertyExpression>
                        </hc:chartProperty>
                        <hc:chartProperty name="id">
                            <hc:propertyExpression><![CDATA["id1"]]></hc:propertyExpression>
                        </hc:chartProperty>
                        <hc:chartProperty name="linkedTo">
                            <hc:propertyExpression><![CDATA[0]]></hc:propertyExpression>
                        </hc:chartProperty>
                        <hc:chartProperty name="min">
                            <hc:propertyExpression><![CDATA[0]]></hc:propertyExpression>
                        </hc:chartProperty>
                        <hc:chartProperty name="title.text">
                            <hc:propertyExpression><![CDATA["Profit"]]></hc:propertyExpression>
                        </hc:chartProperty>
                    </hc:chartSetting>
                    <hc:chartSetting name="yAxis">
                        <hc:chartProperty name="_jrAxisIndex" value="0"/>
                        <hc:chartProperty name="id">
                            <hc:propertyExpression><![CDATA["id0"]]></hc:propertyExpression>
                        </hc:chartProperty>
                        <hc:chartProperty name="min">
                            <hc:propertyExpression><![CDATA[0]]></hc:propertyExpression>
                        </hc:chartProperty>
                        <hc:chartProperty name="title.text">
                            <hc:propertyExpression><![CDATA["Unit and Store Sales"]]></hc:propertyExpression>
                        </hc:chartProperty>
                    </hc:chartSetting>
                    <multiAxisData>
                        <multiAxisDataset/>
                        <dataAxis axis="Rows">
                            <axisLevel name="Month">
                                <labelExpression><![CDATA["Level Label expression"]]></labelExpression>
                                <axisLevelBucket order="None" class="java.lang.String">
                                    <bucketExpression><![CDATA[$F{the_month}]]></bucketExpression>
                                </axisLevelBucket>
                            </axisLevel>
                        </dataAxis>
                        <dataAxis axis="Columns"/>
                        <multiAxisMeasure name="Store Sales" class="java.lang.Integer" calculation="Nothing">
                            <labelExpression><![CDATA["Store Sales"]]></labelExpression>
                            <valueExpression><![CDATA[$F{store_sales}]]></valueExpression>
                        </multiAxisMeasure>
                        <multiAxisMeasure name="Unit Sales" class="java.lang.Integer" calculation="Nothing">
                            <labelExpression><![CDATA["Unit Sales"]]></labelExpression>
                            <valueExpression><![CDATA[$F{unit_sales}]]></valueExpression>
                        </multiAxisMeasure>
                        <multiAxisMeasure name="Profit" class="java.lang.Integer" calculation="Nothing">
                            <labelExpression><![CDATA["Profit"]]></labelExpression>
                            <valueExpression><![CDATA[$F{store_sales}.intValue() -$F{unit_sales}.intValue()]]></valueExpression>
                        </multiAxisMeasure>
                    </multiAxisData>
                    <hc:series name="Store Sales">
                        <hc:contributor name="SeriesProperty">
                            <hc:contributorProperty name="yAxis" valueType="Constant" value="id0"/>
                        </hc:contributor>
                    </hc:series>
                    <hc:series name="Unit Sales">
                        <hc:contributor name="SeriesProperty">
                            <hc:contributorProperty name="yAxis" valueType="Constant" value="id0"/>
                        </hc:contributor>
                    </hc:series>
                    <hc:series name="Profit">
                        <hc:contributor name="SeriesProperty">
                            <hc:contributorProperty name="yAxis" valueType="Constant" value="id1"/>
                        </hc:contributor>
                    </hc:series>
                </hc:chart>
            </componentElement>
        </band>
    </summary>
</jasperReport>
 

Tip : How to enable high charts category axis (X-axis) and value axis (Y-axis) line colors in Jasper Design Studio 6.x or later ?

Hi Folks,

This post will give you the tip of setting Advanced properties to display the Category Axis (X-axis), Value Axis(Y-axis) in HighCharts of Jasper Design Studio.

Software Used for this example : 
1) Jasper Design Studio 6.2 Professional
2) Jasper Server 6.2 Professional
3) Foodmart database of PostgreSQL .

1) Click on Advanced properties of Chart and Click on Add to add below shown properties.
2) Properties : 
xAxis.lineColor = #008000 (check box disabled)
xAxis.lineWidth = new Integer(2) (check box enabled)
yAxis.lineColor = #FF0000 (check box disabled)
yAxis.line.Width= new Integer(1) (check box enabled)


3) Sample output in Server: 
Reference : 
http://jsfiddle.net/gh/get/jquery/1.7.2/highslide-software/highcharts.com/tree/master/samples/highcharts/yaxis/linecolor/

JRXML
<?xml version="1.0" encoding="UTF-8"?>
<!-- Created with Jaspersoft Studio version 6.2.0.final using JasperReports Library version 6.2.0  -->
<!-- 2016-01-27T13:59:59 -->
<jasperReport xmlns="http://jasperreports.sourceforge.net/jasperreports" xmlns:xsi="http://www.w3.org/2001/XMLSchema-instance" xsi:schemaLocation="http://jasperreports.sourceforge.net/jasperreports http://jasperreports.sourceforge.net/xsd/jasperreport.xsd" name="Statcked Bar With LIne" pageWidth="800" pageHeight="842" columnWidth="760" leftMargin="20" rightMargin="20" topMargin="20" bottomMargin="20" uuid="5d0254fd-0a3b-4d5d-8e26-3c4b6c618d0f">
    <property name="com.jaspersoft.studio.data.defaultdataadapter" value="foodmart"/>
    <property name="com.jaspersoft.studio.data.sql.tables" value=""/>
    <property name="ireport.jasperserver.url" value="http://localhost:8081/jasperserver-pro/"/>
    <property name="ireport.jasperserver.user" value="superuser"/>
    <property name="ireport.jasperserver.report.resource" value="/Explore/Reports/Bar_Chart_X_axis_and_Y_axis_Line_Color_files/main_jrxml"/>
    <property name="ireport.jasperserver.reportUnit" value="/Explore/Reports/Bar_Chart_X_axis_and_Y_axis_Line_Color"/>
    <property name="com.jaspersoft.studio.unit." value="pixel"/>
    <queryString>
        <![CDATA[SELECT occupation,member_card,SUM(num_cars_owned) cars,SUM(total_children) children
 FROM customer GROUP BY occupation ,member_card
order by occupation ,member_card]]>
    </queryString>
    <field name="occupation" class="java.lang.String"/>
    <field name="member_card" class="java.lang.String"/>
    <field name="cars" class="java.lang.Long"/>
    <field name="children" class="java.lang.Long"/>
    <background>
        <band splitType="Stretch"/>
    </background>
    <summary>
        <band height="350" splitType="Stretch">
            <property name="com.jaspersoft.studio.unit.height" value="pixel"/>
            <componentElement>
                <reportElement x="0" y="0" width="760" height="350" uuid="fb580735-8c78-4008-93aa-2bd2bc6ed227"/>
                <hc:chart xmlns:hc="http://jaspersoft.com/highcharts" xsi:schemaLocation="http://jaspersoft.com/highcharts http://jaspersoft.com/schema/highcharts.xsd" type="Column">
                    <hc:chartSetting name="default">
                        <hc:chartProperty name="chart.zoomType">
                            <hc:propertyExpression><![CDATA["xy"]]></hc:propertyExpression>
                        </hc:chartProperty>
                        <hc:chartProperty name="colors">
                            <hc:propertyExpression><![CDATA[java.util.Arrays.asList("#7cb5ec","#434348","#90ed7d","#f7a35c","#008000","#f15c80","#e4d354","#2b908f","#f45b5b","#91e8e1")]]></hc:propertyExpression>
                        </hc:chartProperty>
                        <hc:chartProperty name="credits.enabled">
                            <hc:propertyExpression><![CDATA[false]]></hc:propertyExpression>
                        </hc:chartProperty>
                        <hc:chartProperty name="credits.href">
                            <hc:propertyExpression><![CDATA[""]]></hc:propertyExpression>
                        </hc:chartProperty>
                        <hc:chartProperty name="credits.text">
                            <hc:propertyExpression><![CDATA[""]]></hc:propertyExpression>
                        </hc:chartProperty>
                        <hc:chartProperty name="title.text">
                            <hc:propertyExpression><![CDATA[""]]></hc:propertyExpression>
                        </hc:chartProperty>
                        <hc:chartProperty name="xAxis.lineColor" value="#008000"/>
                        <hc:chartProperty name="xAxis.lineWidth">
                            <hc:propertyExpression><![CDATA[new Integer(2)]]></hc:propertyExpression>
                        </hc:chartProperty>
                        <hc:chartProperty name="yAxis.lineColor" value="#FF0000"/>
                        <hc:chartProperty name="yAxis.lineWidth">
                            <hc:propertyExpression><![CDATA[new Integer(2)]]></hc:propertyExpression>
                        </hc:chartProperty>
                        <hc:chartProperty name="yAxis.title.text">
                            <hc:propertyExpression><![CDATA["Number Of Cars"]]></hc:propertyExpression>
                        </hc:chartProperty>
                    </hc:chartSetting>
                    <multiAxisData>
                        <multiAxisDataset/>
                        <dataAxis axis="Rows">
                            <axisLevel name="Level1">
                                <labelExpression><![CDATA["Level Label expression"]]></labelExpression>
                                <axisLevelBucket class="java.lang.String">
                                    <bucketExpression><![CDATA[$F{occupation}]]></bucketExpression>
                                </axisLevelBucket>
                            </axisLevel>
                        </dataAxis>
                        <dataAxis axis="Columns"/>
                        <multiAxisMeasure name="Measure1" class="java.lang.Integer" calculation="Sum">
                            <labelExpression><![CDATA["Number Of Cars : "]]></labelExpression>
                            <valueExpression><![CDATA[$F{cars}]]></valueExpression>
                        </multiAxisMeasure>
                    </multiAxisData>
                    <hc:series name="Measure1"/>
                </hc:chart>
            </componentElement>
        </band>
    </summary>
</jasperReport>
 

Donut and Semi donut high charts (HTML-5) in Jasper Design Studio 6.x (or) How to convert semi pie or pie to semi donut or semi pie chart

Hi Folks,

As of Jasper 6.2 we do not have donut and semi donut high chart visualizations in it.

Using the available semi pie/circular chart and pie chart, we can convert them into semi donut and donut visualizations.
Kindly note that, this post will not tech you how to work with html-5 scripting but will tech you how to grab the properties from highcharts API and make use of them in Jasper Design Studio.

For doing it, we need to add series.innerSize=80% property in "Advanced properties section of both charts. (don't tick the check box).

Example works only in professional studio
Current example tested on : J.D.Studio Pro 6.2 and J.S 6.2 Pro .

NOTE : Click the images to get the best view of the content on them.
*** Sample output of the tip ***
Image may be NSFW.
Clik here to view.


1) Properties set on semi circular chart.

2) Properties set on pie chart


 I have also played with few other advanced and simple properties of semi circular & pie chart and would like to share the purpose of property and how the end use get benefited from it.

You can find all the properties in above two images. 

1) Selection of Slice (Slice will be separated from center) - This is useful for drill down reports - End user can easily understand on which slice he/she clicked.
2) Slice and Label connector line color(By default the chart will take the slice/sector color)
3) Slice shadow on hovering - (Build in property - tick the Show Showdow property from "Plot Options for Series")
4) Change the cursor Style when mouse hovered(better look and feel for the end user if it is a drill down parent report)
5) Percentages as labels.
6) Percentage and Value in Tool tip.
7) Title of Chart in middle of chart(Change X=0 and Y=0 in Chart title properties)


JRXML
<?xml version="1.0" encoding="UTF-8"?>
<!-- Created with Jaspersoft Studio version 6.2.0.final using JasperReports Library version 6.2.0  -->
<!-- 2016-01-29T01:49:52 -->
<jasperReport xmlns="http://jasperreports.sourceforge.net/jasperreports" xmlns:xsi="http://www.w3.org/2001/XMLSchema-instance" xsi:schemaLocation="http://jasperreports.sourceforge.net/jasperreports http://jasperreports.sourceforge.net/xsd/jasperreport.xsd" name="SemiCircularChart" pageWidth="12000" pageHeight="842" columnWidth="11960" leftMargin="20" rightMargin="20" topMargin="20" bottomMargin="20" uuid="5d646afa-9cdc-41f7-aa48-8d901762ed99">
    <property name="com.jaspersoft.studio.data.defaultdataadapter" value="foodmart"/>
    <property name="com.jaspersoft.studio.data.sql.tables" value=""/>
    <property name="com.jaspersoft.studio.unit." value="pixel"/>
    <property name="com.jaspersoft.studio.unit.pageHeight" value="pixel"/>
    <property name="com.jaspersoft.studio.unit.pageWidth" value="pixel"/>
    <property name="com.jaspersoft.studio.unit.topMargin" value="pixel"/>
    <property name="com.jaspersoft.studio.unit.bottomMargin" value="pixel"/>
    <property name="com.jaspersoft.studio.unit.leftMargin" value="pixel"/>
    <property name="com.jaspersoft.studio.unit.rightMargin" value="pixel"/>
    <property name="com.jaspersoft.studio.unit.columnWidth" value="pixel"/>
    <property name="com.jaspersoft.studio.unit.columnSpacing" value="pixel"/>
    <property name="ireport.jasperserver.url" value="http://localhost:8081/jasperserver-pro/"/>
    <property name="ireport.jasperserver.user" value="superuser"/>
    <property name="ireport.jasperserver.report.resource" value="/Explore/Reports/Semi_Donut_and_Donut_Chart_Examples_files/main_jrxml"/>
    <property name="ireport.jasperserver.reportUnit" value="/Explore/Reports/Semi_Donut_and_Donut_Chart_Examples"/>
    <property name="net.sf.jasperreports.export.pdf.encrypted" value="true"/>
    <queryString>
        <![CDATA[SELECT member_card,SUM(num_cars_owned) FROM customer GROUP BY member_card]]>
    </queryString>
    <field name="member_card" class="java.lang.String"/>
    <field name="sum" class="java.lang.Long"/>
    <background>
        <band splitType="Stretch"/>
    </background>
    <title>
        <band height="31" splitType="Stretch"/>
    </title>
    <summary>
        <band height="329" splitType="Stretch">
            <componentElement>
                <reportElement x="0" y="0" width="555" height="329" uuid="f42805af-d872-4e9b-be4d-f29ede7935fe"/>
                <hc:chart xmlns:hc="http://jaspersoft.com/highcharts" xsi:schemaLocation="http://jaspersoft.com/highcharts http://jaspersoft.com/schema/highcharts.xsd" type="SemiPie">
                    <hc:chartSetting name="default">
                        <hc:chartProperty name="chart.zoomType">
                            <hc:propertyExpression><![CDATA["xy"]]></hc:propertyExpression>
                        </hc:chartProperty>
                        <hc:chartProperty name="credits.enabled">
                            <hc:propertyExpression><![CDATA[false]]></hc:propertyExpression>
                        </hc:chartProperty>
                        <hc:chartProperty name="credits.href">
                            <hc:propertyExpression><![CDATA[""]]></hc:propertyExpression>
                        </hc:chartProperty>
                        <hc:chartProperty name="credits.text">
                            <hc:propertyExpression><![CDATA[""]]></hc:propertyExpression>
                        </hc:chartProperty>
                        <hc:chartProperty name="series.innerSize" value="70%"/>
                        <hc:chartProperty name="title.style.color">
                            <hc:propertyExpression><![CDATA[new java.awt.Color(-16111803)]]></hc:propertyExpression>
                        </hc:chartProperty>
                        <hc:chartProperty name="title.style.fontSize">
                            <hc:propertyExpression><![CDATA["12px"]]></hc:propertyExpression>
                        </hc:chartProperty>
                        <hc:chartProperty name="title.text">
                            <hc:propertyExpression><![CDATA["Member Card Wise Cars"]]></hc:propertyExpression>
                        </hc:chartProperty>
                        <hc:chartProperty name="title.verticalAlign">
                            <hc:propertyExpression><![CDATA["middle"]]></hc:propertyExpression>
                        </hc:chartProperty>
                        <hc:chartProperty name="title.y">
                            <hc:propertyExpression><![CDATA[new Integer(40)]]></hc:propertyExpression>
                        </hc:chartProperty>
                        <hc:chartProperty name="yAxis.title.text">
                            <hc:propertyExpression><![CDATA[""]]></hc:propertyExpression>
                        </hc:chartProperty>
                        <hc:chartProperty name="chart.backgroundColor">
                            <hc:propertyExpression><![CDATA[new java.awt.Color(-855822)]]></hc:propertyExpression>
                        </hc:chartProperty>
                    </hc:chartSetting>
                    <multiAxisData>
                        <multiAxisDataset/>
                        <dataAxis axis="Rows">
                            <axisLevel name="Level1">
                                <labelExpression><![CDATA["Level Label expression"]]></labelExpression>
                                <axisLevelBucket class="java.lang.String">
                                    <bucketExpression><![CDATA[$F{member_card}]]></bucketExpression>
                                </axisLevelBucket>
                            </axisLevel>
                        </dataAxis>
                        <multiAxisMeasure name="Measure1" class="java.lang.Integer" calculation="Nothing">
                            <labelExpression><![CDATA["Number Of Cars : "]]></labelExpression>
                            <valueExpression><![CDATA[$F{sum}]]></valueExpression>
                        </multiAxisMeasure>
                    </multiAxisData>
                    <hc:series name="Measure1"/>
                </hc:chart>
            </componentElement>
            <componentElement>
                <reportElement x="600" y="0" width="435" height="329" uuid="ee3464c8-c006-4cd9-abb7-f77b32ae46a9"/>
                <hc:chart xmlns:hc="http://jaspersoft.com/highcharts" xsi:schemaLocation="http://jaspersoft.com/highcharts http://jaspersoft.com/schema/highcharts.xsd" type="Pie">
                    <hc:chartSetting name="default">
                        <hc:chartProperty name="chart.backgroundColor">
                            <hc:propertyExpression><![CDATA[new java.awt.Color(-855822)]]></hc:propertyExpression>
                        </hc:chartProperty>
                        <hc:chartProperty name="chart.type" value="pie"/>
                        <hc:chartProperty name="chart.zoomType">
                            <hc:propertyExpression><![CDATA["xy"]]></hc:propertyExpression>
                        </hc:chartProperty>
                        <hc:chartProperty name="credits.enabled">
                            <hc:propertyExpression><![CDATA[false]]></hc:propertyExpression>
                        </hc:chartProperty>
                        <hc:chartProperty name="credits.href">
                            <hc:propertyExpression><![CDATA[""]]></hc:propertyExpression>
                        </hc:chartProperty>
                        <hc:chartProperty name="credits.text">
                            <hc:propertyExpression><![CDATA[""]]></hc:propertyExpression>
                        </hc:chartProperty>
                        <hc:chartProperty name="plotOptions.pie.cursor" value="pointer"/>
                        <hc:chartProperty name="plotOptions.pie.dataLabels.connectorColor" value="yellow"/>
                        <hc:chartProperty name="plotOptions.pie.dataLabels.enabled" value="false"/>
                        <hc:chartProperty name="plotOptions.pie.dataLabels.format">
                            <hc:propertyExpression><![CDATA[" {point.percentage:.1f} %"]]></hc:propertyExpression>
                        </hc:chartProperty>
                        <hc:chartProperty name="plotOptions.pie.showInLegend" value="true"/>
                        <hc:chartProperty name="plotOptions.series.allowPointSelect">
                            <hc:propertyExpression><![CDATA[Boolean.TRUE]]></hc:propertyExpression>
                        </hc:chartProperty>
                        <hc:chartProperty name="plotOptions.series.showCheckBox">
                            <hc:propertyExpression><![CDATA[Boolean.TRUE]]></hc:propertyExpression>
                        </hc:chartProperty>
                        <hc:chartProperty name="series.innerSize" value="80%"/>
                        <hc:chartProperty name="title.style.color">
                            <hc:propertyExpression><![CDATA[new java.awt.Color(-16369815)]]></hc:propertyExpression>
                        </hc:chartProperty>
                        <hc:chartProperty name="title.style.fontSize">
                            <hc:propertyExpression><![CDATA["12px"]]></hc:propertyExpression>
                        </hc:chartProperty>
                        <hc:chartProperty name="title.text">
                            <hc:propertyExpression><![CDATA["NO.Of.Cars"]]></hc:propertyExpression>
                        </hc:chartProperty>
                        <hc:chartProperty name="title.verticalAlign">
                            <hc:propertyExpression><![CDATA["middle"]]></hc:propertyExpression>
                        </hc:chartProperty>
                        <hc:chartProperty name="title.y">
                            <hc:propertyExpression><![CDATA[new Integer(0)]]></hc:propertyExpression>
                        </hc:chartProperty>
                        <hc:chartProperty name="tooltip.pointFormat">
                            <hc:propertyExpression><![CDATA["{series.name}: <b>{point.percentage:.1f}%</b>" +"("+$F{sum}+")"]]></hc:propertyExpression>
                        </hc:chartProperty>
                        <hc:chartProperty name="tooltip.shared">
                            <hc:propertyExpression><![CDATA[Boolean.TRUE]]></hc:propertyExpression>
                        </hc:chartProperty>
                        <hc:chartProperty name="tooltip.useHTML">
                            <hc:propertyExpression><![CDATA[Boolean.TRUE]]></hc:propertyExpression>
                        </hc:chartProperty>
                        <hc:chartProperty name="yAxis.title.text">
                            <hc:propertyExpression><![CDATA[""]]></hc:propertyExpression>
                        </hc:chartProperty>
                    </hc:chartSetting>
                    <multiAxisData>
                        <multiAxisDataset/>
                        <dataAxis axis="Rows">
                            <axisLevel name="Level1">
                                <labelExpression><![CDATA["Level Label expression"]]></labelExpression>
                                <axisLevelBucket class="java.lang.String">
                                    <bucketExpression><![CDATA[$F{member_card}]]></bucketExpression>
                                </axisLevelBucket>
                            </axisLevel>
                        </dataAxis>
                        <multiAxisMeasure name="Measure1" class="java.lang.Integer" calculation="Nothing">
                            <labelExpression><![CDATA["No.Of Cars"]]></labelExpression>
                            <valueExpression><![CDATA[$F{sum}]]></valueExpression>
                        </multiAxisMeasure>
                    </multiAxisData>
                    <hc:series name="Measure1"/>
                </hc:chart>
            </componentElement>
        </band>
    </summary>
</jasperReport>
 

References : 
http://www.highcharts.com/demo/pie-semi-circle

Jaspersoft Design Studio Tip : Horizontal Spacing, Vertical Spacing of Selected fields


Hi Folks,

This tip is useful for quick development of text field based complex reports.

Are you tired of adjusting vertical or horizontal spacing between two or more textual fields ?

We have Horizontal Spacing and Vertical Spacing options in Studio.

There are 4 types of utilities available for each.

1) Decrease Horizontal Space
2) Increase Horizontal Space
3) Same Horizontal Space and
4) Remove Horizontal Space.


How to ?
* Same Horizontal Space
Problem :
Width of each text field is : 141 px
When you have 100's fields horizontally and want to make the width 120 and equal distance for all the cells you have to perform below.
Solution :
1) Select 1st field and adjust the width to 120 px
2) Multi select all the fields
  Control+Hover mouse on all fields
 3)  After selection of all fields Right click on any cell and click "Horizontal Spacing" and then click on "same horizontal spacing" option.

4) Sample output :


Tip : Special character(Square bullet point) of Arial font type is not exported to PDF from Jasper server - How to work around ?

Hi Folks,

There are few reports which needs to exported with special characters, for instance bullet pointed sentences or some descriptions about some project or etc.  stored in data base field(s) as value(s).

See below image, the text with bullet point is coming in java output in Studio and server UI output but not in PDF either in Studio or Jasper server

Problem Statement Images :
Image-1:
Image-2:

Solution
In Studio :
Steps:
1) Import arial.ttf file into Studio.
( * This file can be found in Fonts folder of windows operating system
  * Location : Control Panel\All Control Panel Items\Fonts
  * Copy paste to Arial folder from Fonts into another folder say in your desktop
 * If you wont' copy paste you can't find arial.ttf file but you could see other arial font files). 
 

2)
* Navigate to Window -> Preference  -> Jasper Studio -> Font from Jasper Studio Menu bar.
* Click on Add button -> be in the "Normal" tab and click on "Browse" button to add the arial.ttf
   file from the copied location.

3)  As shown in below 2 images select the text field and go to its properties.
     Check for PDF options and give properties as shown in below text.
    But when taking the arial.ttf file from jasper server you should change the pdfFontName="repo:/yourfontLocationIntheFolders"


<textField>
                <reportElement key="" x="0" y="0" width="555" height="54" uuid="4de18e79-cf3a-44a2-84c8-efb89d4b2f65"/>
                <textElement verticalAlignment="Middle" markup="html">
                    <font fontName="Arial" size="16" pdfFontName="Arial" pdfEncoding="Identity-H" isPdfEmbedded="true"/>
                </textElement>
                <textFieldExpression><![CDATA[$F{FiledOfSquareShapedSymbolWithText}]]></textFieldExpression>
</textField>


Sample output from Studio when exported to PDF.


 Upload the arial.ttf file in the server as shown in below image : 

I hope this helps someone. !

Thank you for visiting this page. 

Sadakar Pochampalli 

TIBCO Jaspersoft Mobile Business Intelligence - How to connect to a server from mobile & how to view reports ?

Hi Folks,

In this tutorial, you will see a quick walk through on Jasper Mobile Intelligence setup.

1) How to Install App in iPhone ?
2) How to connect to your hosted jasperserver from App ?
3) How to preview a Report in App?


Environment :  
I have taken my own setup for this example, I have used my locally installed jasperserver to connect to mobile app over my home WI-FI network.

1) Windows 10 Operating System on which Jasperserver professional 6.2 installed and running.
2) iPhone 6

1) How to Install App in iPhone ?

  •  From Apple "App Store"  search for "TIBCO JasperMobile"
  • Click on "Install" to get the app & after installation is done see the icon in tray. 
  • More Information can be found at : 
         http://community.jaspersoft.com/mobile
         http://community.jaspersoft.com/project/tibco-jaspermobile-ios

 Image-1 : App in App Store

Image-2:  Open App in Mobile
                    

2) How to connect to your hosted jasperserver in App ?

1) You need to provide Username, Password and server connection details to connect to hosted jasperserver.

2) There is  Server Profiles Page in App to add server(s) to connect. For that you need to click on "Server" (3rd option in image 2).

3) You will see below page & there you need to give below
   Profile name = sadakar local (you can give any name)
   Server address = http://192.168.1.6:8080/japserserver-pro  (www.sadakar.com/jasperserver-pro)
   The above two parameters are mandatory to add a server 
   If your server is on multi tenant jasper environment you need to provide Organization ID 
   Click on Save button to add this server in "Server Profile" list. 
  
  Image-3 : Adding hosted jasperserver in Mobile app "server profile" page.
Image-4: Server Profile list : 
NOTE : If you want to remove this server from list, press on the connection name to get "Edit", "Delete"& "Clone Profile" options. Using these options you can edit the connection, or delete the connection or get a duplicate one.
4)
# Click on "Back button" to come back to the login page
# Give the credentials as shown in below image.
# Username = superuser, Password=superuser and Server=sadakar local  
# Click on "Login" button to connect to the hosted jasperserver. 
Image-5 : Logging into the server


Image-6 : Jasperserver landing page in App after logging. 


3) How to preview a Report ?

# By default when you log into the server in app, it will list down all the reports and dashboards available in "Library" in grid view. 
# Click on the first report "01.Geographic Results by Segment Report"& it starts loading the report. 

Image-6 : 01.Geographic Results by Segment Report mobile horizontal view. 
# Options :
1) Refresh : to refresh the report. 
2) Edit Values : Input controls to the report. 
3) Save : save report as html, pdf or xls formats 
4) Print : Print the report as an image  if the phone is connected to a printer. 
5) Info : Report properties : name, description, path, type , version, creation date & modified date. 
6) Schedule :  Scheduling options from app. 

This way you can work with mobile application. 

Go Pretty with Mobile Intelligence :-)  Instance access to your jasper reports and dashboards :-)

Thank you, I hope it helps someone.


NOTE : If you are experimenting the same at your home using your own WIFI network and Windows and iPhone devices , you should disable the firewall in your windows. 
You can not get the IP opened in your phone browser if you wont stop firewall. 


Cheers :-)

Tip : Cascading parameters - Multi select & check box(boolean true or false) in Jasper Reports

Hi Folks,

This tip is useful if you are loading thousands of values into an input control(single/multi).
How  much time the input control pane is taking to load when you run a large report in which one of the parameter is having thousands of values in it.

The end user(lets say a banking employee) might get nervous to wait for the input pane window opened to run this report(imagine if he will be waiting for 3 to 5 min to load the input pane itself, how much time he/she would has to wait to load the report  - Of course, it is based on your SQL logic but lets say your report is executing in 5 min b'z of heavy transnational data)

Add a check box(boolean) parameter to your input controls pane window and pass this parameter to all your other parameters in the report - i.e., cascade all the other parameters with this boolean parameter.

Once you cascade all the parameters, now when you run the report, the input controls pane for that report will load in matter of seconds hence the user will get experienced of the report is loading.

Lets' see an example for cascading use case with multi select parameter and boolean value

Explaining only on server side :  Cascade "paramCity" multi select parameter with boolean check box parameter. i.e., when you check the tick box then the values in "City" parameter should get loaded.

SELECT distinct state_province,city FROM customer WHERE 'true'=$P{param_CheckMe}

NOTE : In jasper boolean parameters returns true or false. While cascading make sure true should be given in single quotes as shown in above SQL code. 

and the other parameter is "paramCheckMe"is of type "boolean" created.

Screenshots : 


No values populated in "City" parameter when unchecking the boolean parameter (uncheck)

Values populated in "City" parameter when checking the boolean parameter (uncheck)

I hope this helps some one.!

HTML-5 Charts advanced properties best practices in Japser Reports (Uncaught Java Script Error & TypeError: Cannot find function add in object 0 com/jaspersoft/jasperreports/highcharts/charts/render/scripts/highcharts-4.0.3.bbox.js#1969)

Hi All,

In Jasper Reports, when working with Advanced Chart Options with HTML-5 charts, you may experience Uncaught Java Script Error message and while exporting the report you may get below error.

Error Message

net.sf.jasperreports.engine.JRRuntimeException: org.mozilla.javascript.EcmaError: TypeError: Cannot find function add in object 0. (com/jaspersoft/jasperreports/highcharts/charts/render/scripts/highcharts-4.0.3.bbox.js#1969)
Error Message

org.mozilla.javascript.EcmaError: TypeError: Cannot find function add in object 0. (com/jaspersoft/jasperreports/highcharts/charts/render/scripts/highcharts-4.0.3.bbox.js#1969)


How to overcome & What are the best practices while working with Advanced chart properties ? 

1) Point out your query fields to the graph (any graph from HTML-5).
2) For every change in your JRXML (report or chart level) publish to the server and check the export. (Check the output in 4 different browsers IE or Edge , Mozilla, Chrome and Safari).
3) The above problem comes when you add advanced Properties.

 For example: When you add linearGradient property in Advanced Section
chart.backgroundColor.linearGradient = java.util.Arrays.asList(0,0,500,500)
You should check the expression checkbox for the property because the value of the property is written in Java. 

4) Do not use direct values like 3 , 4 or some thing like that instead use parser functions like new Integer(3) or new Integer(4).

5) Also when adding a variable or field with integer follow this method :  
Preferable : $V{someVariable}+new Integer(4) or $F{someField}+new Integer(60)
Not Preferable : $V{someVariable}+4 or $F{someField}+60 

6)  yAxis tick interval
Wrong :


<hc:chartProperty name="yAxis.tickInterval" value="10"/>
 
Correct : 
<hc:chartProperty name="yAxis.tickInterval"><hc:propertyExpression>
<![CDATA[new Integer(10)]]>
</hc:propertyExpression></hc:chartProperty>
 
7) Similarly with all other properties that you take from HTML-5 API should go in the way that the Studio engine can understand the script and exportable into PDF.

I hope this helps someone. !

Thank you.
Sadakar Pochampalli 


Tip : Detail Overflow Vs Streach With Overflow in Jasper Reports - When to use & How to avoid repetaiton(Images or text ) when Detail Overflow for a Text Field

Hi All,

This tip is useful when you work with grid reports.

Detail Overflow :
The element will be printed when the band overflows to a new page or a new column.

Stretch with Overflow : 
Tell the report engine to allow the text field to stretch downwards in order to display all its text when it doesn't fit in the defined text field height.
This property will work irrespective of cell height that you provide.

(NOTE : You can hover the mouse on the property to view the purpose of it, this way you can learn each and every property available in Studio)

Both are the properties of a text field.


Example Details Overflow : 
On the text field(all text fields) select
Position Type = Float
Stretch Type = Relative to Tallest Object
Detail Overflow = check this
Stretch with Overflow = check this

Page-1 output :
Page-2 output:

From the above images, what you can understand is when Detail overflow is checked the text Static Text and Image filed data is repeating in next page.
If you uncheck it it will not repeat in page-2 :

for example
On the text field(all text fields) select
Position Type = Float
Stretch Type = Relative to Tallest Object
Detail Overflow = Uncheck this 
Stretch with Overflow = check this

Page-1 output portion in the bottom :
Page-2 output

Hope it helps someone.! 
Cheers.!!

 Sample JRXML : Japsersoft stduio Professional 6.2


<?xml version="1.0" encoding="UTF-8"?>
<!-- Created with Jaspersoft Studio version 6.2.0.final using JasperReports Library version 6.2.0  -->
<!-- 2016-03-08T12:50:05 -->
<jasperReport xmlns="http://jasperreports.sourceforge.net/jasperreports" xmlns:xsi="http://www.w3.org/2001/XMLSchema-instance" xsi:schemaLocation="http://jasperreports.sourceforge.net/jasperreports http://jasperreports.sourceforge.net/xsd/jasperreport.xsd" name="Test" pageWidth="595" pageHeight="842" whenNoDataType="AllSectionsNoDetail" columnWidth="555" leftMargin="20" rightMargin="20" topMargin="20" bottomMargin="20" uuid="f86bcfb7-d774-451f-9f46-c58f57e0efbb">
    <property name="com.jaspersoft.studio.data.sql.tables" value=""/>
    <property name="com.jaspersoft.studio.data.defaultdataadapter" value="foodmart"/>
    <queryString>
        <![CDATA[select * from dummy]]>
    </queryString>
    <field name="sno" class="java.lang.Integer"/>
    <field name="filed1" class="java.lang.Integer"/>
    <field name="filed2" class="java.lang.String"/>
    <columnHeader>
        <band height="30">
            <staticText>
                <reportElement x="0" y="0" width="120" height="30" uuid="0cd17b54-755c-42fe-9363-7266a24337e3"/>
                <box>
                    <topPen lineWidth="0.5" lineStyle="Solid" lineColor="#000000"/>
                    <leftPen lineWidth="0.5" lineStyle="Solid" lineColor="#000000"/>
                    <bottomPen lineWidth="0.5" lineStyle="Solid" lineColor="#000000"/>
                    <rightPen lineWidth="0.5" lineStyle="Solid" lineColor="#000000"/>
                </box>
                <text><![CDATA[Static Text]]></text>
            </staticText>
            <staticText>
                <reportElement x="170" y="0" width="130" height="30" uuid="f216b782-3080-4ba8-8cc3-2609c684f4be"/>
                <box>
                    <topPen lineWidth="0.5" lineStyle="Solid" lineColor="#000000"/>
                    <leftPen lineWidth="0.5" lineStyle="Solid" lineColor="#000000"/>
                    <bottomPen lineWidth="0.5" lineStyle="Solid" lineColor="#000000"/>
                    <rightPen lineWidth="0.5" lineStyle="Solid" lineColor="#000000"/>
                </box>
                <text><![CDATA[filed1]]></text>
            </staticText>
            <staticText>
                <reportElement x="300" y="0" width="90" height="30" uuid="71985024-8b9a-49ae-81e0-6d6e9335cec7"/>
                <box>
                    <topPen lineWidth="0.5" lineStyle="Solid" lineColor="#000000"/>
                    <leftPen lineWidth="0.5" lineStyle="Solid" lineColor="#000000"/>
                    <bottomPen lineWidth="0.5" lineStyle="Solid" lineColor="#000000"/>
                    <rightPen lineWidth="0.5" lineStyle="Solid" lineColor="#000000"/>
                </box>
                <text><![CDATA[filed2]]></text>
            </staticText>
            <staticText>
                <reportElement x="120" y="0" width="50" height="30" uuid="d45c0977-d842-424b-ab44-7edd5672b72d"/>
                <box>
                    <topPen lineWidth="0.5" lineStyle="Solid" lineColor="#000000"/>
                    <leftPen lineWidth="0.5" lineStyle="Solid" lineColor="#000000"/>
                    <bottomPen lineWidth="0.5" lineStyle="Solid" lineColor="#000000"/>
                    <rightPen lineWidth="0.5" lineStyle="Solid" lineColor="#000000"/>
                </box>
                <text><![CDATA[Image]]></text>
            </staticText>
        </band>
    </columnHeader>
    <detail>
        <band height="30">
            <textField isStretchWithOverflow="true">
                <reportElement positionType="Float" stretchType="RelativeToTallestObject" x="0" y="0" width="120" height="30" isPrintWhenDetailOverflows="true" uuid="fb93f1ac-7f7a-48fe-afa7-4aab5370cbec"/>
                <box>
                    <topPen lineWidth="0.5" lineStyle="Solid" lineColor="#000000"/>
                    <leftPen lineWidth="0.5" lineStyle="Solid" lineColor="#000000"/>
                    <bottomPen lineWidth="0.5" lineStyle="Solid" lineColor="#000000"/>
                    <rightPen lineWidth="0.5" lineStyle="Solid" lineColor="#000000"/>
                </box>
                <textFieldExpression><![CDATA[""]]></textFieldExpression>
            </textField>
            <textField isStretchWithOverflow="true">
                <reportElement positionType="Float" stretchType="RelativeToTallestObject" x="170" y="0" width="130" height="30" uuid="b5a72533-c1b6-4af9-a0b7-06d099981190"/>
                <box>
                    <topPen lineWidth="0.5" lineStyle="Solid" lineColor="#000000"/>
                    <leftPen lineWidth="0.5" lineStyle="Solid" lineColor="#000000"/>
                    <bottomPen lineWidth="0.5" lineStyle="Solid" lineColor="#000000"/>
                    <rightPen lineWidth="0.5" lineStyle="Solid" lineColor="#000000"/>
                </box>
                <textFieldExpression><![CDATA[$F{filed1}]]></textFieldExpression>
            </textField>
            <textField isStretchWithOverflow="true">
                <reportElement positionType="Float" stretchType="RelativeToTallestObject" x="300" y="0" width="90" height="30" uuid="bab5a3e9-22db-46b0-9302-f7614a6f6add"/>
                <box>
                    <topPen lineWidth="0.5" lineStyle="Solid" lineColor="#000000"/>
                    <leftPen lineWidth="0.5" lineStyle="Solid" lineColor="#000000"/>
                    <bottomPen lineWidth="0.5" lineStyle="Solid" lineColor="#000000"/>
                    <rightPen lineWidth="0.5" lineStyle="Solid" lineColor="#000000"/>
                </box>
                <textFieldExpression><![CDATA[$F{filed2}]]></textFieldExpression>
            </textField>
            <textField isStretchWithOverflow="true">
                <reportElement positionType="Float" stretchType="RelativeToTallestObject" x="0" y="0" width="120" height="30" uuid="d4338fad-1803-491e-90ef-8e01cb3de80d"/>
                <box>
                    <topPen lineWidth="0.5" lineStyle="Solid" lineColor="#000000"/>
                    <leftPen lineWidth="0.5" lineStyle="Solid" lineColor="#000000"/>
                    <bottomPen lineWidth="0.5" lineStyle="Solid" lineColor="#000000"/>
                    <rightPen lineWidth="0.5" lineStyle="Solid" lineColor="#000000"/>
                </box>
                <textFieldExpression><![CDATA["Hello"]]></textFieldExpression>
            </textField>
            <textField isStretchWithOverflow="true">
                <reportElement positionType="Float" stretchType="RelativeToTallestObject" x="170" y="0" width="130" height="30" uuid="8cdac468-0a3f-4ed3-844b-473e1371f92e"/>
                <box>
                    <topPen lineWidth="0.5" lineStyle="Solid" lineColor="#000000"/>
                    <leftPen lineWidth="0.5" lineStyle="Solid" lineColor="#000000"/>
                    <bottomPen lineWidth="0.5" lineStyle="Solid" lineColor="#000000"/>
                    <rightPen lineWidth="0.5" lineStyle="Solid" lineColor="#000000"/>
                </box>
                <textFieldExpression><![CDATA[""]]></textFieldExpression>
            </textField>
            <textField isStretchWithOverflow="true">
                <reportElement positionType="Float" stretchType="RelativeToTallestObject" x="120" y="0" width="50" height="30" uuid="6ab2f4f8-04cd-4a6f-b945-3a7af4b8c3fa"/>
                <box>
                    <topPen lineWidth="0.5" lineStyle="Solid" lineColor="#000000"/>
                    <leftPen lineWidth="0.5" lineStyle="Solid" lineColor="#000000"/>
                    <bottomPen lineWidth="0.5" lineStyle="Solid" lineColor="#000000"/>
                    <rightPen lineWidth="0.5" lineStyle="Solid" lineColor="#000000"/>
                </box>
                <textFieldExpression><![CDATA["Hello"]]></textFieldExpression>
            </textField>
        </band>
    </detail>
</jasperReport>

Learn new features in Jasper Server 6.2 : Exporting Jaspersoft dashboard to PDF, WORD , PNG and OTD - How to Guide

Hi,

Jasper server 6.2 Pro/EE releases have lots of improvements and new features. Today, I have gone through one of the features on server side in dashboard designer ,  that is Exporting dashboard to 4 variety of formats namely PDF, MS-Word , PNG image and OTD.

In this tip, you will learn/see how to export dashboard in above formats

1) Dashboard designer properties section has a check box(In the designer mode of dashboard right click anywhere on the canvas)  to enable dashboard export button when previewing.

2) After checking it in dashboard designer properties if you try exporting the dashboard you may get error message.

3) To make sure the export button working correctly, you need to install the PhantomJS software in the machine/server where your jasperserver is hosted/installed.

4) Download and keep the PhantomJS in C drive or somewhere in the directory.

PhantomJS download Link : 
http://phantomjs.org/download.html

5) Extract the zip file and keep the phantomjs-2.1.1-windowsfolder in C drive.  
Example : C:\phantomjs-2.1.1-windows
Inside into it, in the bin folder you can see phantomjs.exefile.

6) You need to give the above .exe path  in js.config.properties file
File Path :
C:\Jaspersoft\jasperreports-server-6.2.0\apache-tomcat\webapps\jasperserver-pro\WEB-INF

i.e., Add below line in above file

phantomjs.binary=C:\\phantomjs-2.1.1-windows\\bin\\phantomjs.exe

7) Restart the the Jasper server if it is already runningand see the preview of dashboard and make use of export button.


Example :  1) Exporting Supermart dashboard to PDF

1) Open the dashboard in Edit mode  or go to the dashboard designer

2) Click the settings button and check the "Show export button" option.
3) Save your dashboard and click on run button

4) Click on "Export" Button to export to PDF or PNG or DOCX or OTD

5) Sample Export to PDF
Image-1 : 

Image-2 :


I hope it helps someone in configuring and in how to do .

Until Next  Post..
Sadakar Pochampalli 


Tip : Row banding and column banding OR alternative colors for rows and columns in Jaspersoft Studio 6.x in cross tab component

Hi Folks,

Usually we write grid reports by making use of column header and Detail band or table component in JRXML file. 

When write a grid report using column headers, we make use of Styles and conditional expression with REPORT_COUNT variable to get the alternative colors, similarly when we use Table component, we take check box utility in its style section to get the alternative colors functionally.

Today, I need to implement the row or column banding in cross tab component - cross tab also mean to display grid data but the data will be grouped by rows and columns. Neither we can't use  REPORT_COUNT variable on cross tab fields nor any utility.

Here are the steps to have row or column banding.

1) Write your cross tabular report.
2) Go to Style section from report outline or cross tab outline.
3) Create a Style -> Create two conditional Styles. One for row banding another for column banding.
    Lets say Style name is Style1
4) Write below condition in 1st condition & on its Appearance section choose row banding color.
    $V{ROW_COUNT}%2==0
5) Write below condition in 2nd condition of same Style1& on its Appearance section choose another color for column
   $V{COLUMN_COUNT}%2==0
6) Now , go the cross tabs text elements and select them and apply Style1 in Appearance section for Style property.
7) Save your report and preview.

NOTE : 
1) While choosing colors on condition do not uncheck "Transperant" property.
2) On cross tab text fields you must uncheck "Transparent" property.
3)  COLUMN_COUNT and ROW_COUNT are built in variables that you can see in grayed out color in Variables section.
4) ROW_COUNT is not available by default in variables section in 6.2 studio.

Sample output : 
1) Cross tab row banding
 
2) Cross tab row banding + Column banding


Style code in JRXML : 
    <style name="Style1">
        <conditionalStyle>
            <conditionExpression><![CDATA[$V{ROW_COUNT}%2==0]]></conditionExpression>
            <style backcolor="#C6EDF7"/>
        </conditionalStyle>
        <conditionalStyle>
            <conditionExpression><![CDATA[$V{COLUMN_COUNT}%2==0]]></conditionExpression>
            <style backcolor="#DBB2D3"/>
        </conditionalStyle>
    </style>


Applying Row banding code sample on a text field
<textField>
   <reportElement style="Style1" mode="Opaque" x="0" y="0" width="60" height="20" uuid="2dd638c2-fd6a-4bbf-8fb9-f9807dc1ee97"/>
   <textElement textAlignment="Left" verticalAlignment="Middle"/>
   <textFieldExpression><![CDATA[$V{education1}]]></textFieldExpression>
     </textField>


 References : 
http://jasperreports.sourceforge.net/sample.reference/crosstabs/index.html


Full Sample JRXML : Jaspersoft Design Studio 6.2 Professional code and runs on foodmart db of postgres

 
<?xml version="1.0" encoding="UTF-8"?>
<!-- Created with Jaspersoft Studio version 6.2.0.final using JasperReports Library version 6.2.0  -->
<!-- 2016-03-19T01:30:11 -->
<jasperReport xmlns="http://jasperreports.sourceforge.net/jasperreports" xmlns:xsi="http://www.w3.org/2001/XMLSchema-instance" xsi:schemaLocation="http://jasperreports.sourceforge.net/jasperreports http://jasperreports.sourceforge.net/xsd/jasperreport.xsd" name="cross tab" pageWidth="900" pageHeight="842" columnWidth="860" leftMargin="20" rightMargin="20" topMargin="20" bottomMargin="20" uuid="919521d7-927b-4cd9-b646-0b6cc361b467">
    <property name="com.jaspersoft.studio.data.sql.tables" value=""/>
    <property name="com.jaspersoft.studio.unit." value="pixel"/>
    <property name="com.jaspersoft.studio.unit.pageHeight" value="pixel"/>
    <property name="com.jaspersoft.studio.unit.pageWidth" value="pixel"/>
    <property name="com.jaspersoft.studio.unit.topMargin" value="pixel"/>
    <property name="com.jaspersoft.studio.unit.bottomMargin" value="pixel"/>
    <property name="com.jaspersoft.studio.unit.leftMargin" value="pixel"/>
    <property name="com.jaspersoft.studio.unit.rightMargin" value="pixel"/>
    <property name="com.jaspersoft.studio.unit.columnWidth" value="pixel"/>
    <property name="com.jaspersoft.studio.unit.columnSpacing" value="pixel"/>
    <style name="Crosstab_CH" mode="Opaque" backcolor="#F0F8FF">
        <box>
            <pen lineWidth="0.5" lineColor="#000000"/>
            <topPen lineWidth="0.5" lineColor="#000000"/>
            <leftPen lineWidth="0.5" lineColor="#000000"/>
            <bottomPen lineWidth="0.5" lineColor="#000000"/>
            <rightPen lineWidth="0.5" lineColor="#000000"/>
        </box>
    </style>
    <style name="Crosstab_CG" mode="Opaque" backcolor="#BFE1FF">
        <box>
            <pen lineWidth="0.5" lineColor="#000000"/>
            <topPen lineWidth="0.5" lineColor="#000000"/>
            <leftPen lineWidth="0.5" lineColor="#000000"/>
            <bottomPen lineWidth="0.5" lineColor="#000000"/>
            <rightPen lineWidth="0.5" lineColor="#000000"/>
        </box>
    </style>
    <style name="Crosstab_CT" mode="Opaque" backcolor="#005FB3">
        <box>
            <pen lineWidth="0.5" lineColor="#000000"/>
            <topPen lineWidth="0.5" lineColor="#000000"/>
            <leftPen lineWidth="0.5" lineColor="#000000"/>
            <bottomPen lineWidth="0.5" lineColor="#000000"/>
            <rightPen lineWidth="0.5" lineColor="#000000"/>
        </box>
    </style>
    <style name="Crosstab_CD" mode="Opaque" backcolor="#FFFFFF">
        <box>
            <pen lineWidth="0.5" lineColor="#000000"/>
            <topPen lineWidth="0.5" lineColor="#000000"/>
            <leftPen lineWidth="0.5" lineColor="#000000"/>
            <bottomPen lineWidth="0.5" lineColor="#000000"/>
            <rightPen lineWidth="0.5" lineColor="#000000"/>
        </box>
    </style>
    <style name="Style1">
        <conditionalStyle>
            <conditionExpression><![CDATA[$V{ROW_COUNT}%2==0]]></conditionExpression>
            <style backcolor="#C6EDF7"/>
        </conditionalStyle>
        <conditionalStyle>
            <conditionExpression><![CDATA[$V{COLUMN_COUNT}%2==0]]></conditionExpression>
            <style backcolor="#DBB2D3"/>
        </conditionalStyle>
    </style>
    <queryString>
        <![CDATA[SELECT * FROM customer]]>
    </queryString>
    <field name="customer_id" class="java.lang.Integer"/>
    <field name="account_num" class="java.lang.Long"/>
    <field name="lname" class="java.lang.String"/>
    <field name="fname" class="java.lang.String"/>
    <field name="mi" class="java.lang.String"/>
    <field name="address1" class="java.lang.String"/>
    <field name="address2" class="java.lang.String"/>
    <field name="address3" class="java.lang.String"/>
    <field name="address4" class="java.lang.String"/>
    <field name="city" class="java.lang.String"/>
    <field name="state_province" class="java.lang.String"/>
    <field name="postal_code" class="java.lang.String"/>
    <field name="country" class="java.lang.String"/>
    <field name="customer_region_id" class="java.lang.Integer"/>
    <field name="phone1" class="java.lang.String"/>
    <field name="phone2" class="java.lang.String"/>
    <field name="birthdate" class="java.sql.Date"/>
    <field name="marital_status" class="java.lang.String"/>
    <field name="yearly_income" class="java.lang.String"/>
    <field name="gender" class="java.lang.String"/>
    <field name="total_children" class="java.lang.Integer"/>
    <field name="num_children_at_home" class="java.lang.Integer"/>
    <field name="education" class="java.lang.String"/>
    <field name="date_accnt_opened" class="java.sql.Date"/>
    <field name="member_card" class="java.lang.String"/>
    <field name="occupation" class="java.lang.String"/>
    <field name="houseowner" class="java.lang.String"/>
    <field name="num_cars_owned" class="java.lang.Integer"/>
    <field name="fullname" class="java.lang.String"/>
    <background>
        <band splitType="Stretch"/>
    </background>
    <title>
        <band height="50"/>
    </title>
    <summary>
        <band height="65" splitType="Stretch">
            <crosstab>
                <reportElement x="0" y="0" width="860" height="65" uuid="a84e27b9-2297-4bb0-9e07-61e9dd9ba7db">
                    <property name="com.jaspersoft.studio.layout" value="com.jaspersoft.studio.editor.layout.VerticalRowLayout"/>
                </reportElement>
                <rowGroup name="education1" width="60" totalPosition="End">
                    <bucket class="java.lang.String">
                        <bucketExpression><![CDATA[$F{education}]]></bucketExpression>
                    </bucket>
                    <crosstabRowHeader>
                        <cellContents mode="Opaque" style="Crosstab_CH">
                            <textField>
                                <reportElement style="Style1" mode="Opaque" x="0" y="0" width="60" height="20" uuid="2dd638c2-fd6a-4bbf-8fb9-f9807dc1ee97"/>
                                <textElement textAlignment="Left" verticalAlignment="Middle"/>
                                <textFieldExpression><![CDATA[$V{education1}]]></textFieldExpression>
                            </textField>
                        </cellContents>
                    </crosstabRowHeader>
                    <crosstabTotalRowHeader>
                        <cellContents mode="Opaque" style="Crosstab_CT">
                            <staticText>
                                <reportElement x="0" y="0" width="60" height="20" forecolor="#FFFFFF" uuid="30a79663-0b76-4abc-9bdf-ea5e07e948b2"/>
                                <textElement textAlignment="Center" verticalAlignment="Middle"/>
                                <text><![CDATA[Total education1]]></text>
                            </staticText>
                        </cellContents>
                    </crosstabTotalRowHeader>
                </rowGroup>
                <columnGroup name="occupation1" height="20" totalPosition="End">
                    <bucket class="java.lang.String">
                        <bucketExpression><![CDATA[$F{occupation}]]></bucketExpression>
                    </bucket>
                    <crosstabColumnHeader>
                        <cellContents mode="Opaque" style="Crosstab_CH">
                            <textField>
                                <reportElement x="0" y="0" width="60" height="20" uuid="9253a1ec-7290-4556-8c8e-342f8f25855f"/>
                                <textElement textAlignment="Center" verticalAlignment="Middle"/>
                                <textFieldExpression><![CDATA[$V{occupation1}]]></textFieldExpression>
                            </textField>
                        </cellContents>
                    </crosstabColumnHeader>
                    <crosstabTotalColumnHeader>
                        <cellContents mode="Opaque" style="Crosstab_CT">
                            <staticText>
                                <reportElement x="0" y="0" width="60" height="20" forecolor="#FFFFFF" uuid="d93ba240-0361-4d4a-b9b7-c044815db4b5"/>
                                <textElement textAlignment="Center" verticalAlignment="Middle"/>
                                <text><![CDATA[Total occupation1]]></text>
                            </staticText>
                        </cellContents>
                    </crosstabTotalColumnHeader>
                </columnGroup>
                <columnGroup name="gender1" height="20">
                    <bucket class="java.lang.String">
                        <bucketExpression><![CDATA[$F{gender}]]></bucketExpression>
                    </bucket>
                    <crosstabColumnHeader>
                        <cellContents mode="Opaque" style="Crosstab_CH">
                            <textField>
                                <reportElement x="0" y="0" width="60" height="20" uuid="490b42a0-ef38-4349-9800-d14fc159a8f6"/>
                                <textElement textAlignment="Center" verticalAlignment="Middle"/>
                                <textFieldExpression><![CDATA[$V{gender1}]]></textFieldExpression>
                            </textField>
                        </cellContents>
                    </crosstabColumnHeader>
                    <crosstabTotalColumnHeader>
                        <cellContents>
                            <staticText>
                                <reportElement x="0" y="0" width="60" height="20" uuid="84014d77-4b07-4b51-85ac-21eb7ba521f5"/>
                                <text><![CDATA[Total Column Group1]]></text>
                            </staticText>
                        </cellContents>
                    </crosstabTotalColumnHeader>
                </columnGroup>
                <measure name="total_children_MEASURE1" class="java.lang.Integer" calculation="Sum">
                    <measureExpression><![CDATA[$F{total_children}]]></measureExpression>
                </measure>
                <crosstabCell width="60" height="20">
                    <cellContents mode="Opaque" style="Crosstab_CD">
                        <textField>
                            <reportElement style="Style1" mode="Opaque" x="0" y="0" width="60" height="20" uuid="96136dd9-4455-4486-86a4-4837a7361a6f"/>
                            <textElement textAlignment="Center" verticalAlignment="Middle"/>
                            <textFieldExpression><![CDATA[$V{total_children_MEASURE1}]]></textFieldExpression>
                        </textField>
                    </cellContents>
                </crosstabCell>
                <crosstabCell width="60" height="20" columnTotalGroup="occupation1">
                    <cellContents mode="Opaque" style="Crosstab_CT">
                        <textField>
                            <reportElement x="0" y="0" width="60" height="20" forecolor="#FFFFFF" uuid="8d952fc1-2878-4ba9-8224-9b1637995a15"/>
                            <textElement textAlignment="Center" verticalAlignment="Middle"/>
                            <textFieldExpression><![CDATA[$V{total_children_MEASURE1}]]></textFieldExpression>
                        </textField>
                    </cellContents>
                </crosstabCell>
                <crosstabCell width="60" height="20" rowTotalGroup="education1">
                    <cellContents mode="Opaque" style="Crosstab_CT">
                        <textField>
                            <reportElement x="0" y="0" width="60" height="20" forecolor="#FFFFFF" uuid="fa8c9b2f-c393-4ab9-b8d0-d20e564d03e7"/>
                            <textElement textAlignment="Center" verticalAlignment="Middle"/>
                            <textFieldExpression><![CDATA[$V{total_children_MEASURE1}]]></textFieldExpression>
                        </textField>
                    </cellContents>
                </crosstabCell>
                <crosstabCell width="60" height="20" rowTotalGroup="education1" columnTotalGroup="occupation1">
                    <cellContents mode="Opaque" style="Crosstab_CT">
                        <textField>
                            <reportElement x="0" y="0" width="60" height="20" forecolor="#FFFFFF" uuid="9f0a729a-a6b0-49c5-938c-604267f0d758"/>
                            <textElement textAlignment="Center" verticalAlignment="Middle"/>
                            <textFieldExpression><![CDATA[$V{total_children_MEASURE1}]]></textFieldExpression>
                        </textField>
                    </cellContents>
                </crosstabCell>
                <crosstabCell width="60" height="20" columnTotalGroup="gender1">
                    <cellContents/>
                </crosstabCell>
                <crosstabCell width="60" height="20" rowTotalGroup="education1" columnTotalGroup="gender1">
                    <cellContents mode="Opaque" style="Crosstab_CT"/>
                </crosstabCell>
            </crosstab>
        </band>
    </summary>
</jasperReport>

Tip : Japsersoft Design Studio \.metadata\.log error

Hi,
When you see \.metadata\.log error while launching Studio, you can follow below steps to launch it successfully,

Steps :
1) Go to C:\Users\sadakar\JaspersoftWorkspace\.metadata\.plugins\org.eclipse.core.resources
2) Delete .snap file
3) Now, launch Studio

:-)

Tip : Excel Export Expand(+) and Collapse(-) for grouped data in Jasper Reports (or) The Outline Row Level Property for Excel Extract Reports in Jaspersoft

Hi,

In this post you can learn how to get Expand and Collapse options when exporting a grouped by data excel report.

Steps : 
1) Design report as follows 
     
      Group Header  ($F{city})
             Detail (some fields)
      Group Footer (Dummy Text field with 0 height). 

(Click on image to get the best view)


2) Apply Body property to the fields that you keep in Detail Band
net.sf.jasperreports.export.xls.row.outline.level.1=Body

(click on Image to get the best of content)
 

3) Apply End property to the dummy field that you keep in Footer band.
net.sf.jasperreports.export.xls.row.outline.level.1=END

(Click on image to get the best view)
4) Sample Excel outputs
(Collapsed Stage)
A group expansion stage : 

References : 
http://jasperreports.sourceforge.net/sample.reference/xlsfeatures/


Sample JRXML ( works on 6.2 or later Jasper Studio professional with foodmart database )
 <?xml version="1.0" encoding="UTF-8"?>
<!-- Created with Jaspersoft Studio version 6.2.0.final using JasperReports Library version 6.2.0  -->
<!-- 2016-03-29T18:23:38 -->
<jasperReport xmlns="http://jasperreports.sourceforge.net/jasperreports" xmlns:xsi="http://www.w3.org/2001/XMLSchema-instance" xsi:schemaLocation="http://jasperreports.sourceforge.net/jasperreports http://jasperreports.sourceforge.net/xsd/jasperreport.xsd" name="Expand and Collapse Excel" pageWidth="595" pageHeight="842" columnWidth="595" leftMargin="0" rightMargin="0" topMargin="0" bottomMargin="0" uuid="58e9ce0f-5fbd-48ec-8645-53f5a0b2ad01">
    <property name="com.jaspersoft.studio.data.sql.tables" value=""/>
    <property name="com.jaspersoft.studio.unit." value="pixel"/>
    <property name="com.jaspersoft.studio.unit.pageHeight" value="pixel"/>
    <property name="com.jaspersoft.studio.unit.pageWidth" value="pixel"/>
    <property name="com.jaspersoft.studio.unit.topMargin" value="pixel"/>
    <property name="com.jaspersoft.studio.unit.bottomMargin" value="pixel"/>
    <property name="com.jaspersoft.studio.unit.leftMargin" value="pixel"/>
    <property name="com.jaspersoft.studio.unit.rightMargin" value="pixel"/>
    <property name="com.jaspersoft.studio.unit.columnWidth" value="pixel"/>
    <property name="com.jaspersoft.studio.unit.columnSpacing" value="pixel"/>
    <property name="com.jaspersoft.studio.data.defaultdataadapter" value="foodmart"/>
    <property name="ireport.jasperserver.url" value="http://localhost:8081/jasperserver-pro/"/>
    <property name="ireport.jasperserver.user" value="superuser"/>
    <property name="ireport.jasperserver.report.resource" value="/2_Training_Naresh/Reports/21_Expand_and_Collapse_Excel_Export_files/main_jrxml"/>
    <property name="ireport.jasperserver.reportUnit" value="/2_Training_Naresh/Reports/21_Expand_and_Collapse_Excel_Export"/>
    <queryString>
        <![CDATA[SELECT * FROM customer ORDER BY city]]>
    </queryString>
    <field name="customer_id" class="java.lang.Integer"/>
    <field name="account_num" class="java.lang.Long"/>
    <field name="lname" class="java.lang.String"/>
    <field name="fname" class="java.lang.String"/>
    <field name="mi" class="java.lang.String"/>
    <field name="address1" class="java.lang.String"/>
    <field name="address2" class="java.lang.String"/>
    <field name="address3" class="java.lang.String"/>
    <field name="address4" class="java.lang.String"/>
    <field name="city" class="java.lang.String"/>
    <field name="state_province" class="java.lang.String"/>
    <field name="postal_code" class="java.lang.String"/>
    <field name="country" class="java.lang.String"/>
    <field name="customer_region_id" class="java.lang.Integer"/>
    <field name="phone1" class="java.lang.String"/>
    <field name="phone2" class="java.lang.String"/>
    <field name="birthdate" class="java.sql.Date"/>
    <field name="marital_status" class="java.lang.String"/>
    <field name="yearly_income" class="java.lang.String"/>
    <field name="gender" class="java.lang.String"/>
    <field name="total_children" class="java.lang.Integer"/>
    <field name="num_children_at_home" class="java.lang.Integer"/>
    <field name="education" class="java.lang.String"/>
    <field name="date_accnt_opened" class="java.sql.Date"/>
    <field name="member_card" class="java.lang.String"/>
    <field name="occupation" class="java.lang.String"/>
    <field name="houseowner" class="java.lang.String"/>
    <field name="num_cars_owned" class="java.lang.Integer"/>
    <field name="fullname" class="java.lang.String"/>
    <group name="city">
        <groupExpression><![CDATA[$F{city}]]></groupExpression>
        <groupHeader>
            <band height="16">
                <property name="com.jaspersoft.studio.unit.height" value="pixel"/>
                <textField>
                    <reportElement x="0" y="0" width="100" height="16" uuid="752494bc-a3a7-447b-b24a-16dd57b4e203">
                        <property name="com.jaspersoft.studio.unit.height" value="pixel"/>
                    </reportElement>
                    <box leftPadding="5"/>
                    <textElement verticalAlignment="Middle">
                        <font isBold="true"/>
                    </textElement>
                    <textFieldExpression><![CDATA[$F{city}]]></textFieldExpression>
                </textField>
                <textField>
                    <reportElement x="100" y="0" width="100" height="16" uuid="4edb4831-d823-471c-8cdf-9621627e0fc9">
                        <property name="com.jaspersoft.studio.unit.height" value="pixel"/>
                    </reportElement>
                    <textElement verticalAlignment="Middle">
                        <font isBold="true"/>
                    </textElement>
                    <textFieldExpression><![CDATA[""]]></textFieldExpression>
                </textField>
                <textField>
                    <reportElement x="200" y="0" width="100" height="16" uuid="925b91cc-0b9e-4c68-b43e-01546ae19316">
                        <property name="net.sf.jasperreports.export.xls.row.outline.level.1" value="Body"/>
                        <property name="com.jaspersoft.studio.unit.height" value="pixel"/>
                    </reportElement>
                    <textElement textAlignment="Center" verticalAlignment="Middle"/>
                    <textFieldExpression><![CDATA[""]]></textFieldExpression>
                </textField>
                <textField>
                    <reportElement x="300" y="0" width="120" height="16" uuid="607f71cb-a9c1-4417-bfa3-cc4bac1f81c2">
                        <property name="net.sf.jasperreports.export.xls.row.outline.level.1" value="Body"/>
                        <property name="com.jaspersoft.studio.unit.height" value="pixel"/>
                    </reportElement>
                    <textElement textAlignment="Center" verticalAlignment="Middle"/>
                    <textFieldExpression><![CDATA[""]]></textFieldExpression>
                </textField>
                <textField>
                    <reportElement x="420" y="0" width="175" height="16" uuid="1508d978-b950-4f89-a362-d944afcd326c">
                        <property name="net.sf.jasperreports.export.xls.row.outline.level.1" value="Body"/>
                        <property name="com.jaspersoft.studio.unit.height" value="pixel"/>
                    </reportElement>
                    <textElement textAlignment="Center" verticalAlignment="Middle"/>
                    <textFieldExpression><![CDATA[""]]></textFieldExpression>
                </textField>
            </band>
        </groupHeader>
        <groupFooter>
            <band>
                <textField>
                    <reportElement x="0" y="0" width="100" height="0" uuid="24a95893-5789-4871-bca0-f6d7f8a9bcf4">
                        <property name="net.sf.jasperreports.export.xls.row.outline.level.1" value="END"/>
                    </reportElement>
                    <textFieldExpression><![CDATA["Text Field"]]></textFieldExpression>
                </textField>
            </band>
        </groupFooter>
    </group>
    <columnHeader>
        <band height="16" splitType="Stretch">
            <printWhenExpression><![CDATA[$V{PAGE_COUNT}==1]]></printWhenExpression>
            <staticText>
                <reportElement x="100" y="0" width="100" height="16" uuid="0d2dd0ef-ad82-40cb-b7af-6cdbedc6fa12"/>
                <textElement textAlignment="Center" verticalAlignment="Middle"/>
                <text><![CDATA[Customer ID]]></text>
            </staticText>
            <staticText>
                <reportElement x="200" y="0" width="100" height="16" uuid="b1f7385d-2678-405c-bdc1-1ebf363d1f16"/>
                <textElement textAlignment="Center" verticalAlignment="Middle"/>
                <text><![CDATA[Customer Name]]></text>
            </staticText>
            <staticText>
                <reportElement x="300" y="0" width="120" height="16" uuid="72efd2e8-b27c-49f5-bbf6-7f0cf7b65868"/>
                <textElement textAlignment="Center" verticalAlignment="Middle"/>
                <text><![CDATA[Occupation]]></text>
            </staticText>
            <staticText>
                <reportElement x="420" y="0" width="175" height="16" uuid="71a0dffd-4d85-40f0-b04e-b966697b8a14">
                    <property name="com.jaspersoft.studio.unit.height" value="pixel"/>
                </reportElement>
                <textElement textAlignment="Center"/>
                <text><![CDATA[Phone Number]]></text>
            </staticText>
            <textField>
                <reportElement x="0" y="0" width="100" height="16" uuid="126c9bef-1748-4333-b3c4-dd641268e523">
                    <property name="com.jaspersoft.studio.unit.height" value="pixel"/>
                </reportElement>
                <textElement verticalAlignment="Middle">
                    <font isBold="true"/>
                </textElement>
                <textFieldExpression><![CDATA[""]]></textFieldExpression>
            </textField>
        </band>
    </columnHeader>
    <detail>
        <band height="16" splitType="Stretch">
            <textField>
                <reportElement x="100" y="0" width="100" height="16" uuid="262d3c0f-c9d4-4198-a6f1-4235e12967f6">
                    <property name="net.sf.jasperreports.export.xls.row.outline.level.1" value="Body"/>
                    <property name="com.jaspersoft.studio.unit.height" value="pixel"/>
                </reportElement>
                <textElement textAlignment="Center" verticalAlignment="Middle"/>
                <textFieldExpression><![CDATA[$F{customer_id}]]></textFieldExpression>
            </textField>
            <textField>
                <reportElement x="200" y="0" width="100" height="16" uuid="23a4613e-cbc2-49fa-8b85-c8c1c2b85538">
                    <property name="net.sf.jasperreports.export.xls.row.outline.level.1" value="Body"/>
                    <property name="com.jaspersoft.studio.unit.height" value="pixel"/>
                </reportElement>
                <textElement textAlignment="Center" verticalAlignment="Middle"/>
                <textFieldExpression><![CDATA[$F{fullname}]]></textFieldExpression>
            </textField>
            <textField>
                <reportElement x="300" y="0" width="120" height="16" uuid="9bdd418b-5ed5-4731-bb47-5f662f214693">
                    <property name="net.sf.jasperreports.export.xls.row.outline.level.1" value="Body"/>
                    <property name="com.jaspersoft.studio.unit.height" value="pixel"/>
                </reportElement>
                <textElement textAlignment="Center" verticalAlignment="Middle"/>
                <textFieldExpression><![CDATA[$F{occupation}]]></textFieldExpression>
            </textField>
            <textField>
                <reportElement x="420" y="0" width="175" height="16" uuid="1f727d26-1462-4c6a-8e6b-5dbb0e05668d">
                    <property name="net.sf.jasperreports.export.xls.row.outline.level.1" value="Body"/>
                    <property name="com.jaspersoft.studio.unit.height" value="pixel"/>
                </reportElement>
                <textElement textAlignment="Center" verticalAlignment="Middle"/>
                <textFieldExpression><![CDATA[$F{phone1}]]></textFieldExpression>
            </textField>
            <textField>
                <reportElement x="0" y="0" width="100" height="16" uuid="282bb881-bc06-490f-83b2-a34764648547">
                    <property name="com.jaspersoft.studio.unit.height" value="pixel"/>
                </reportElement>
                <textElement verticalAlignment="Middle">
                    <font isBold="true"/>
                </textElement>
                <textFieldExpression><![CDATA[""]]></textFieldExpression>
            </textField>
        </band>
    </detail>
</jasperReport>


I hope it helps some one. .! & thank you to the friend who explained this to me today.  :-) :-)

References: 
http://jasperreports.sourceforge.net/sample.reference/xlsfeatures/ 
Viewing all 261 articles
Browse latest View live


<script src="https://jsc.adskeeper.com/r/s/rssing.com.1596347.js" async> </script>