Quantcast
Channel: Pochampalli IT Labs
Viewing all 261 articles
Browse latest View live

Jaspersoft CE 6.1 release : Capabilities of Community Server & the new Look.


Learn Jaspersoft BI - Jasper Design Studio 6.x or iReport 5.x course structure

$
0
0

Click images to get better view of the content

Core Jasper Design Studio reporting concepts + Advanced Jasper Designer reporting concepts.

Construction of full content in progress. 


Samples :


Jaspersoft

Learn Jaspersoft BI - Understanding Ad-hoc Editor, Ad-hoc Views(Types) and Ad-hoc Reports

$
0
0
Hi Folks,

Are you looking to understand, learn and work on Jasper Servers server side reporting ?
Here you go ! Find the content and samples slides in below images & ask for a demo/knowledge transfer session.

Software used : 
TIBCOJaspersoft 6.1 Professional
Postgresql foodmart database

NOTE : Click on images to get the best view of content placed.


Agenda 
 Sample Slides 


Lets connect and learn together - The Enterprise features of TIBCOJaspersoft 6.1 :-) :-) 

Thank you for your time on this page.!

Cheers!
Regards,
Sadakar Pochampalli

Installation of TIBCOJasperserver 6.1 Professional in Ubuntu 15.04 (Installing TIBCOJasperserver in VMware guest ubuntu server and access from windows 10 host)

$
0
0
Hello Readers,

This post will teach you how to install latest TIBCOJaspersoft 6.1 Professional in Ubuntu 15.04 server and access it from client machines like Mac, Windows.

I had already published a post earlier on installation  procedure on Ubuntu ( you can find here http://jasper-bi-suite.blogspot.in/2014/02/installation-of-jasper-server-55-pro-in.html)

Though the installation steps would be the same, the approach & the environment setup is completely different.

Environment : 
1) Server machine ( Ubuntu 15.04 - 64 bit)
2) Client machines ( Windows 10 -  64 bit -Developers/Users can access the jasperserver installed on                                   Ubuntu server locally).
3) I used my local machine for Server and Client machines where I installed VMware 10.0.1 and installed Ubuntu 15.04 server (not desktop ubuntu )  as Guest and used my regular windows 10 as Host.
4) Web browsers - Microsoft Edge

Now follow below steps if you are looking for the same setup in your local environment or for your office environment.


Quick Steps
1) Identify Ubuntu server CPU type (64 bit or 32 bit).
2) Check 8080 opened in Ubuntu server or not. If not opened, open it
3) Create a folder in Ubuntu server directory and download the Jasperserver software and apply chmod 777 command for downloaded file.

4) Install the Jasperserver software
5) Check the VMware internet routing between Host(Windows 10)  and Guest(Ubuntu).
6) Access the Jasperserver in Microsoft Edge browser in Windows 10.


Steps Explained in detail :

1) Identify Ubuntu server CPU type (64 bit or 32 bit)

    #  Type uname -m command on terminal
    #  Check the OS is 64 or 32 bit

2) Check 8080 opened in Ubuntu server or not. If not opened, open it

    # Type netstat -an | grep 8080| grep LISTEN on terminal
    # If it returns nothing, that means you can use 8080 (If it been used by any other server, hmmm
        take network admin help or google(my approach) ).

    A Quick snapshot on above 2 points


3) Create a folder in Ubuntu server directory and download the Jasperserver software and apply chmod 777 command for downloaded file. 

   # Create a folder to keep the software (lets say "jasper" )

   # Download the jasperserver using wget command.
    Example :
   wget https://community.jaspersoft.com/modal_forms/nojs/jf-user-login-register?optoutdest=https://d2ev2buidpvgfo.cloudfront.net/6.1/Installers/jasperreports-server-6.1.0-linux-x64-installer.run

   # Once the download is completed apply chmod 777 command
   Example
    chomod 777 *.run


4) Install the Jasperserver software

 # Use below command to install the Jasperserver
 # Example :
    ./ jasperreports-server-6.1.0-linux-x64-installer.run


# Follow the on screen steps, accept the licence, click on continue to agree the licence terms and click on Y(yes) or enter till you get the progress ( in #####) of installation.
# Choose full or custom installation options (1 or 2)


5) Check the VMware internet routing between Host(Windows 10)  and Guest(Ubuntu).

# On the Menu bar go to VM -> Settings and then click on "Network Adapter" in HardwareTab
# Check "NAT" option and check "Connected" and "Connect at power on" in Device status.
# Check the ip address of Ubuntu (Guest in our case) using "ifconfig" command on the terminal.


6) Access the Jasperserver in Microsoft Edge browser in Windows 10.
   
   #  Be in Host machine (windows 10) and open Microsoft Edge browser
   # call the Jasper server URL and login with superuser/superuser credentials
   #  Example : http://192.168.1.128:8080/jasperserver-pro/


We are done ...!!!

Did you find it useful ? Share it for other community folks...!!!

Cheers.!

Regards
Sadakar Pochampalli

Tip : Export Images to Excel Export in TIBCOJapser Server 6.1 Professional

$
0
0
Hi Folks,

Below explained tip is very useful for getting images(usually logos of companies/clients) when exporting reports to Excel(Excel Paginated).

Software used to test this tip : Jasper Design Studio Pro 6.1 and Jasper Server 6.01 Pro
1) Click on the Report Name in outline section. (Highlight the report name).
2)  Go the properties and from the list of drop down choose
net.sf.jasperreports.export.xls.ignore.graphics
3) By default above property value is true
4) Make it false i.e,
net.sf.jasperreports.export.xls.ignore.graphics = false

Find the image below for quick understanding.


Sample output : Excel Export


Reference :
http://community.jaspersoft.com/wiki/no-images-xls-export
http://jasperreports.sourceforge.net/sample.reference/xlsfeatures/

:-) :-)  
 

Step By Step Procedure to run the existing examples of D3 chart samples(that comes with product) in 6.x Jasper Design Studio 6.x and Jasper Server 6.x CE(Pro)

$
0
0
Hi Folks,

In this tutorial, you will learn/see how to run D3 chart(s) samples that comes with TIBCOJasperserver 6.x product.
Notice that you will only see how to run the existing samples given by Jaspersoft in Jaspersoft Design Studio 6.x and Jasperserver CE 6.x and in upcoming posts you will find creation/development other D3 visualizations.

This post is specific for below software setup as on this article written date (9th Sep 2015). With future releases of product the procedure may change as the sources of this article are saying that they eventually move the jars/files to Jasper Libraries.

Software Used for Testing :
1) JasperDesign Studio CE 6.1 installed as a plug to Eclipse Java EE IDE for Web Developers.                                                                                                         Version: Mars Release (4.5.0)
   (You can use stand alone studio - I just wanted to get the studio in Eclipse )
2) Jasperserver 6.1 CE
3) Operating System : Windows 10
4) Java 1.7 installed in OS.

This post is divided into 2 parts. 
1) Executing/Running the samples in Jasper Design Studio
2) Executing/Running the samples in Jasper Server


NOTE : Click the images to get the best view of content 

1) Executing/Running the samples in Jasper Design Studio 6.x (I used 6.1 and the latest release is 6.1.1)

1) Installation of PhantomJS and setting path of its executable file in Jasper Studio.
2) Setting the path for require.js
3) Setting customvisualization pattern path

1) Installation of PhantomJS and setting path of its executable file in Jasper Studio.

a) Download the PhantomJS software from here : http://phantomjs.org/ and unzip it. 


b) Set the above .exe as path JapserDesign Studio properties (Images shown below are from Eclipse). 

Go to Windows -> Click on Preferences  -> Jasper Design Studio -> Click on Properties

com.jaspersoft.jasperreports.components.customvisualization.phantomjs.executable.path =C:/Users/Sadakar/Downloads/backup/phantomjs-2.0.0-windows/phantomjs-2.0.0-windows/bin/phantomjs.exe

com.jaspersoft.jasperreports.components.customvisualization.require.js=file:/E:/1_Softwares/JAVA IDE/eclipse-jee-mars-R-win32-x86_64/eclipse/configuration/org.eclipse.osgi/936/0/.cp/resources/scripts/require-2.1.6.src.js

c) Add custom visualization pattern property

net.sf.jasperreports.web.resource.pattern.customvisualization =com/jaspersoft/jasperreports/customvisualization/.*

(Note that require.js by default comes with Jasper Design Studio 6.x and as I am using Eclipse I have referred the hard coded path. Also, this property by default set in the properties.. Just check whether it is there or not, if not provide the path).

Quick Understanding Images : 
1st two properties image


3rd property image


d) Import the the existing example(s) D3 charts project zip file to Studio and run the reports. 
Jaspersoft has provided few examples demonstrations that you can download from here

Direct Download Link (In feature it may move)
http://community.jaspersoft.com/sites/default/files/wiki_attachments/cvc_samples_20150127.tgz

Or

Go to this page http://community.jaspersoft.com/wiki/custom-visualization-component-v60x-how-run-samples and check the "Installing the samples" section and download the zip file.

Now, In studio
File > Import > General > Existing Projects into Work space > Select Archive file > select the downloaded zip file > Click Next then Finish.


Each of the folder is an example of D3 visualization.

e) Run the report 
Expand an example : lets say raphael_map and observe the the different .js files and .jrxml/.jasper file. (While developing we won't get all these. To get all of them, right click on folder name and build it or right click on build.js file and build the file.. Observe the newly generated .js files).

Now, open the .jrxml file and click on Preview button.


Exporting to PDF


Do the same for other samples ..
(Got null pointer exception when previewed in Interactive preview - Need to check, will update this point).

2) Executing/Running the samples in Jasper Server 

1) Give the path of PhantomJS .exe file in Computer Environment variables. 

2) Add below properties in jasperserver.properties file

File location : C:\Jaspersoft\jasperreports-server-cp-6.1.0\apache-tomcat\webapps\jasperserver\WEB-INF\classes

com.jaspersoft.jasperreports.components.customvisualization.require.js=file:/E:/1_Softwares/JAVA IDE/eclipse-jee-mars-R-win32-x86_64/eclipse/configuration/org.eclipse.osgi/936/0/.cp/resources/scripts/require-2.1.6.src.js

net.sf.jasperreports.web.resource.pattern.customvisualization.scripts=com/jaspersoft/jasperreports/customvisualization/resources/require/.*

NOTE : look at the yellow colored things in above code and do it this way.

3) Publish the Reports to the Jasper and view the output
a) Open the JRXML from the folder.
b) Click on Publish button -> the server will pick .js file and JRXMl file.
c) Provide data source ( for this example : JNDI data source I have chosen as suggested in WIKI pages).
d) Browse the repository(jasper server) for the report and click on RUN button.

4) Sample output 


Exporting to PDF


Another Example sample output : 

In futures posts we will see how we can develop our own D3 visualizations. (If the script is not limited by Jasper licences).

: -) Add links or references in comment box if you already have an example and help the community

Thank you for your time on this page. Suggestions and improvements are always welcome.

Did you find it useful ? Please share this page for community developers.

References : 
1) http://community.jaspersoft.com/wiki/custom-visualization-component-v60x
2) http://community.jaspersoft.com/wiki/custom-visualization-component-setup-jasperreports-server
3) http://community.jaspersoft.com/wiki/custom-visualization-component-v60x-how-run-samples
4) http://community.jaspersoft.com/questions/851432/custom-visualization-component-community-version-faild
5) http://community.jaspersoft.com/questions/847377/problems-custom-visualization-component-windows
6) http://community.jaspersoft.com/jaspersoft-studio/issues/4096
7) http://community.jaspersoft.com/documentation/tibco-jaspersoft-studio-user-guide/v610/custom-visualization-component


Tip : How to Handle null values when passing nothing in Single Select Query parameter in Jasper Design Studio 6.x (Or) Get all the data of query result set when passing nothing in Jasper Design Studio 6.x

$
0
0
Hi Community,

In this post we will see how to handle NULL input (-- input value in single select parameter) in single select parameter.
i.e., When passing (--) input get all the values of query result set and when passing some value from selected input control get the report output for only that parameter.

Note that this example doesn't cover step by step procedure to develop a report from scratch.
Click on images to get the best view of content placed over.

Software Used to test this example : 
TIBCOJasper Design Studio 6.1.1 CE final
TIBCO Jasper Server 6.1 CE final
PostgreSQL database - foodmart database

Core part of the example 

1) Design the report as usually.

2) Create filter for your report, in this example lets create a folder for education filed
     parameter name : param_Education
     Type : java.lang.String
      Default value : I have not taken any.

3) Query
SQL Query
SELECT DISTINCT
                        education,state_province,
                       sum(total_children) "Total Children",
                       sum(num_children_at_home) "Children at home"
FROM customer
WHERE (education = $P{param_Education} OR  $P{param_Education} IS NULL)
GROUP BY
              education,
             state_province
ORDER BY
         education,
         state_province

4)
# Publish the report to the server (point out the report to use foodmart database created in jasperserver - which is not discussed in this post).

# Create the parameter in jasper server with the same id .
parameter name : Education
parameter id : param_Education
parameter type : Single Select Query

# Give the data source connection for parameter and write the query for this parameter to get the values in input control drop down.

Input control query : SELECT DISTINCT education FROM customer

# Do not select parameter as Mandatory


5) Preview of the report in Jasperserver by selecting input control as

Test 1 : Select nothing and click on Apply button ( i.e., select -- from drop down and click on apply button). 


Test-2 : By selecting an input control value


Download Example :Click Me

References :

 http://stackoverflow.com/questions/4697187/need-for-a-jasperreports-null-parameter-value-to-show-all

I hope this helps some one :-)

Did you find it useful ? Please share for community developer like us..!!!

Improvements, suggestions are welcome.

Cheers...!!!


Use Case : Handling multi select parameter at report level in TIBCO Jaspersoft BI (OR) "Filter Expression" example to filter(multi select) the data at report level in TIBCO Jaspersoft BI

$
0
0
Hi Folks,

Here is my new workout on filtering data at report level instead of query level in TIBCO Jaspersoft Reports. I hope you will find this useful.

When we can go with this approach?
1) Situations when you can't send  multi select parameter to Stored Procedures from Jasper. (I have tested with Oracle SP & hoping that the same would work in other RDBMS stored procedure methodologies ). 
2) Situations when you write complex sub queries to get the the multiple values WHERE IN clause of main query.

This example, I have explored while converting Business Objects crystal reports into TIBCO Jaspersoft reports.

Software used for the use case : 
1) OS : Windows 10
2) TIBCO Jasper Design Studio 6.1 CE
3) TIBCO Jaspersoft server 6.1 CE
4) Mozilla firefox browser
5) Database : PostgreSQL and foodmart database

NOTE:
# Assuming that the reader is fa-miler in basics of report design and  I will be covering the core part of the use case in this post
# Click the images to get the best view of the content.

USE CASE Description : 
Select few fields from customer table to have a tabular report output.
Filter the data at query level on gender field and filter the data at report level using country field.

i.e., parameter associated with gender filed is single select and parameter associated with country field is multi select which would applied on report but not the query.

1) Create new report and create data source connections.
2) Create 2 parameters. One will be used at query(param_Gender) and another will be used at "Filter Expression" of the report.

##) param_Country (java.util.List is the type) - It will be used in "Filter Expression"
 ##) param_Gender(java.lang.String is the type) - It will be used in Query
3) Write below query to the report.
SELECT * FROM customer WHERE (gender= $P{param_Gender} or $P{param_Gender} IS NULL)

4)Scroll down "Data set and Query Dialog" editor and click on "Filter Expression" tab from the bottom Menu.

5) Writebelow expression in the "Filter Expression" area (Open the expression editor)
(
        $P{param_Country}.isEmpty()
    )
    ?
    (
        $P{param_Country} != null
    )
    :
    (
        ((ArrayList) $P{REPORT_PARAMETERS_MAP}.get( "param_Country" )).contains($F{country}.toString())
    )


6) Save the report and Preview.
Output test 1 : 
 ( select no elements for param_Country parameter and "F" for param_Gender).
You will get all the elements of gender F type. )
 i.e., When you don't pass anything in param_Country get all the result set of F type.

Output test 2 : 
Pass two values (Mexico and Canada) for param_Country and M type gender for param_Gender
You will get the output of M type gender who are from Mexico and Canada country.


Server side output:
1) Publish the report to the server.
2) Create these param_Country and param_Gender parameters in repository and link them to the report from server UI.
NOTE : param_Country is a multi select Query and param_Gender is single select query inputs.
Queries are :
#) param_Country takes SELECT DISTINCT country FROM customer
#) value and visible columns will be country filed.

#) param_Gender takes SELECT DISTINCT gender FROM customer 
#) value and visible columns will be gender field.


That's all. you are done writing parameters at query level as well report level.

Do you want to test the same example in your environment ?

Click this link to download the JRXML file & Project Export zip file.

# You can test it using stand alone JRXML in studio or by Importing the zip file into your server.
# Make sure you are running postgresql foodmart data base to get the output for this example.


Best Practices : 
1) Analyze the code in "Filter Expression". There could be other ways to achieve this.
2) Note that java.util.List type parameter take multiple values from parameters prompt.
3) There is no concept explained related to java.lang.Collection and $X{IN, fieldName, paramName} for this example. i.e., Report developer can assume that there would be only $X{} syntax way to pass multiple values which is not correct in few situvations.

I hope this will be helpful. If you find it useful please do share by clicking g+ on the page so that developers like us get benefit if they have the similar kind of requirement.
Also, suggestions & comments or alternative solutions are always welcome in comment box.


References :  

http://stackoverflow.com/questions/11512034/does-java-util-list-isempty-check-if-the-list-itself-is-null

 http://community.jaspersoft.com/questions/542895/dataset-expression-filter-filtering-using-contents-report-parameter-type


Thank you for finding this page & some time on this.

Cheers..!!!
Sadakar Pochampalli


Tip : Handling NULL values for integer/Number type parameters in Stored Procedure Reports in Jaspersoft Business Intelligence Reports

$
0
0
Problem Statement : 
# How to pass null values to Integer/Number type parameters in Stored Procedures.

# Usually, we show textual information in the parameter drop down & in the back end pass
      IDs  related to that textual information.

# When we show textual information in the drop down we get --- (triple dashes) for single
        select  query parameter that means NULL(or null).

# When we pass this null value the stored procedure parameter which is Integer/Number type parameter doesn't understand and throws exception.

# Lets say the SQL part inside the SP is handling NULL values with 0 (zero) which will returning
    all the data (B'z Integer/Number type parameters don't accept NULL values in some cases if you won't handle it using nvl function of SQL.


Solution : 
Example : SP with static values
Return all the values of stored procedure when passing 0's.
{
  call procedure_employee(
                                                0,
                                                0,
                                                $P{ORACLE_REF_CURSOR} )
}

Return nothing when pass NULL values
{
  call procedure_employee(
                                                '  ',
                                                '  ',
                                                $P{ORACLE_REF_CURSOR} )
}
Example of SP with parameters which will return all the values of SP.

{
         call procedure_employee(
                                                        nvl($P{param_empID},0) ,       
                                                        nvl($P{param_ManagerID},0),
                                                        $P{ORACLE_REF_CURSOR}
                                              )
}

i.e., nvl function can be used with parameters in SQL stored procedure. 

NOTE : 
# $P{ORACLE_REF_CURSOR} is an java.sql.Resultset type Build in parameter 
     in jasper studio/iReport.  
# Enclose stored procedure call in curly braces {} and select query language type as PL/SQL in studio query dialogue window. 
# For String type single select query parameter it is not required to use nvl function. While writing SQL code inside Stored procedure we can write some thing like 
     WHERE <Field_Name>=<Parameter_Name> OR <Parameter_Name> IS NULL

I hope this helps some one.! I must thank you to my colleague in suggesting this approach to experiment on the SP call with Integer type single select NULL value.

Thank you. 
Sadakar Pochampalli


TIP: LoggedIn User Name defaut value expression in Jasper Server 6.x

$
0
0
How to get the default value of logged in user in jasper server input control.

1) Create a parameter named with "LoggedInUser" (Don't give double quotes).
    Give type as : com.jaspersoft.jasperserver.api.metadata.user.domain.User
NOTE:
# LoggedInUser is a default parameter provided by the product which is not visible. We have to manually create and use.
# Do not give this parameter is for prompting ( i.e., deselect the check box).

2) Create another parameter of your choice ( I have created "User" as another parameter).
Give type as : java.lang.String
Give default value expression as : $P{LoggedInUser}.getUsername()

3) Publish the report to the server and check the text field poped up with logged In User Name

Test Image : 


References : 
http://community.jaspersoft.com/wiki/built-parameters-logged-user

JRXML (Copy paste the code in Professional 6.x Studio report and observe the parameters and expressions). 


<?xml version="1.0" encoding="UTF-8"?>
<!-- Created with Jaspersoft Studio version 6.1.0.final using JasperReports Library version 6.1.0  -->
<!-- 2015-10-13T23:55:04 -->
<jasperReport xmlns="http://jasperreports.sourceforge.net/jasperreports" xmlns:xsi="http://www.w3.org/2001/XMLSchema-instance" xsi:schemaLocation="http://jasperreports.sourceforge.net/jasperreports http://jasperreports.sourceforge.net/xsd/jasperreport.xsd" name="UserName" pageWidth="595" pageHeight="842" whenNoDataType="AllSectionsNoDetail" columnWidth="555" leftMargin="20" rightMargin="20" topMargin="20" bottomMargin="20" uuid="83eecdc9-c7c8-4d1a-9508-923092906537">
    <property name="ireport.jasperserver.url" value="http://localhost:8080/jasperserver-pro/"/>
    <property name="ireport.jasperserver.user" value="superuser"/>
    <property name="ireport.jasperserver.report.resource" value="/Training/UserName_files/main_jrxml"/>
    <property name="ireport.jasperserver.reportUnit" value="/Training/UserName"/>
    <parameter name="LoggedInUser" class="com.jaspersoft.jasperserver.api.metadata.user.domain.User" isForPrompting="false"/>
    <parameter name="User" class="java.lang.String">
        <defaultValueExpression><![CDATA[$P{LoggedInUser}.getUsername()]]></defaultValueExpression>
    </parameter>
    <queryString>
        <![CDATA[]]>
    </queryString>
    <background>
        <band splitType="Stretch"/>
    </background>
    <title>
        <band height="30" splitType="Stretch">
            <textField>
                <reportElement x="120" y="0" width="120" height="30" uuid="b4ccca7e-ad0e-4202-85f4-a4117b1a7c57"/>
                <textElement textAlignment="Left" verticalAlignment="Middle">
                    <font size="12" isBold="true"/>
                </textElement>
                <textFieldExpression><![CDATA[$P{User}]]></textFieldExpression>
            </textField>
            <textField>
                <reportElement x="0" y="0" width="120" height="30" uuid="dcbe87b3-fb60-488b-a959-4317df54299f"/>
                <textElement textAlignment="Center" verticalAlignment="Middle">
                    <font size="12" isBold="true"/>
                </textElement>
                <textFieldExpression><![CDATA["User Name :"]]></textFieldExpression>
            </textField>
        </band>
    </title>
</jasperReport>

TIP : Get Prvious and Next Months month Names in Jasper Reports

$
0
0
Hi guys,


# Add below code to JRXML <import value="org.apache.commons.lang.time.*"/>
# Take a parameter lets say "Date" and its type as "java.util.Date"
# Default value expression : new Date()

# D


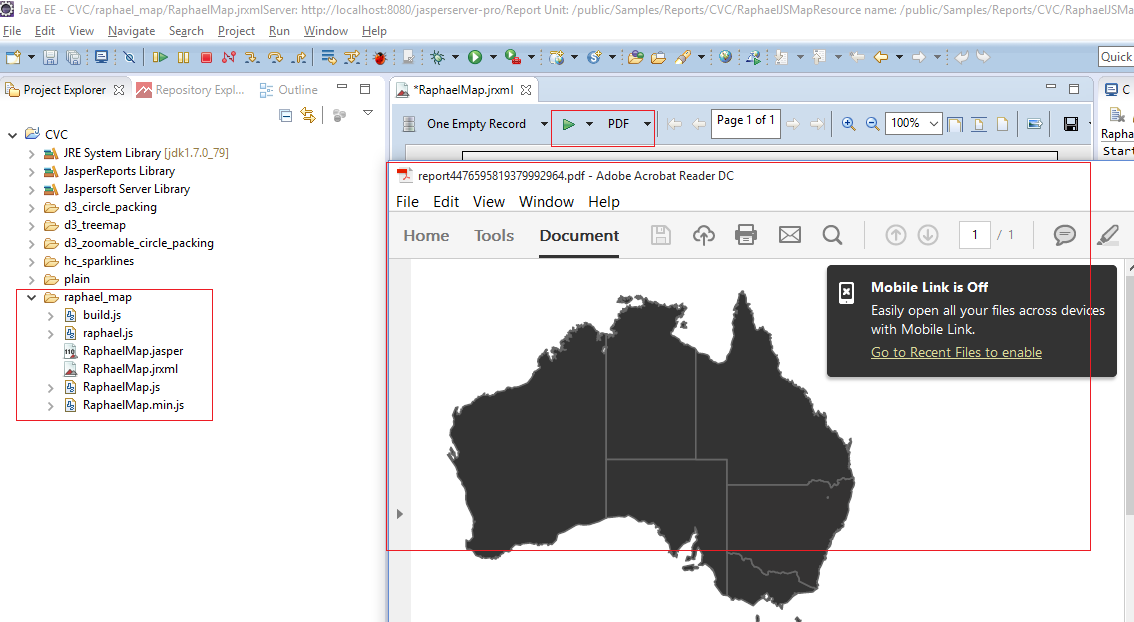
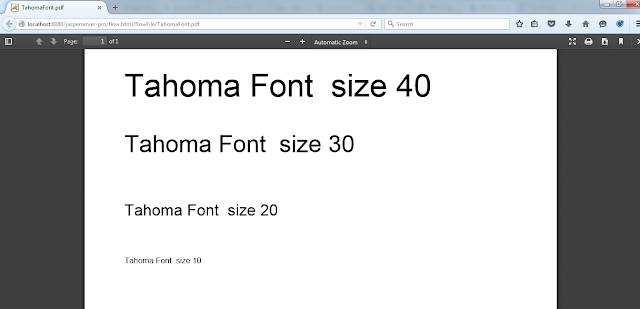
JRXML (Works only in Professional Jasper Studio )

<?xml version="1.0" encoding="UTF-8"?>
<!-- Created with Jaspersoft Studio version 6.1.0.final using JasperReports Library version 6.1.0  -->
<!-- 2015-10-14T15:27:28 -->
<jasperReport xmlns="http://jasperreports.sourceforge.net/jasperreports" xmlns:xsi="http://www.w3.org/2001/XMLSchema-instance" xsi:schemaLocation="http://jasperreports.sourceforge.net/jasperreports http://jasperreports.sourceforge.net/xsd/jasperreport.xsd" name="Get Prvious and Next Months month Names" pageWidth="590" pageHeight="842" columnWidth="550" leftMargin="20" rightMargin="20" topMargin="20" bottomMargin="20" uuid="586bcdf6-d4c0-4e91-b47f-552a90f90619">
    <property name="com.jaspersoft.studio.data.defaultdataadapter" value="One Empty Record"/>
    <property name="com.jaspersoft.studio.unit." value="pixel"/>
    <property name="com.jaspersoft.studio.unit.pageHeight" value="pixel"/>
    <property name="com.jaspersoft.studio.unit.pageWidth" value="pixel"/>
    <property name="com.jaspersoft.studio.unit.topMargin" value="pixel"/>
    <property name="com.jaspersoft.studio.unit.bottomMargin" value="pixel"/>
    <property name="com.jaspersoft.studio.unit.leftMargin" value="pixel"/>
    <property name="com.jaspersoft.studio.unit.rightMargin" value="pixel"/>
    <property name="com.jaspersoft.studio.unit.columnWidth" value="pixel"/>
    <property name="com.jaspersoft.studio.unit.columnSpacing" value="pixel"/>
   <import value="org.apache.commons.lang.time.*"/>
    <parameter name="Date" class="java.util.Date">
        <defaultValueExpression><![CDATA[new Date()]]></defaultValueExpression>
    </parameter>
    <queryString>
        <![CDATA[]]>
    </queryString>
    <background>
        <band splitType="Stretch"/>
    </background>
    <title>
        <band height="150" splitType="Stretch">
            <textField>
                <reportElement mode="Opaque" x="160" y="30" width="390" height="30" backcolor="#EDF7FF" uuid="e65ee664-6d00-4776-8a31-d2014241ebec"/>
                <box leftPadding="10">
                    <topPen lineWidth="0.5" lineStyle="Solid" lineColor="#000000"/>
                    <leftPen lineWidth="0.5" lineStyle="Solid" lineColor="#000000"/>
                    <bottomPen lineWidth="0.5" lineStyle="Solid" lineColor="#000000"/>
                    <rightPen lineWidth="0.5" lineStyle="Solid" lineColor="#000000"/>
                </box>
                <textElement verticalAlignment="Middle">
                    <font fontName="Calibri" size="12"/>
                </textElement>
                <textFieldExpression><![CDATA[$P{Date}]]></textFieldExpression>
            </textField>
            <textField>
                <reportElement mode="Opaque" x="160" y="60" width="390" height="30" backcolor="#EDF7FF" uuid="31f2ad0a-7a43-474c-8827-6e0adedd0cc0"/>
                <box leftPadding="10">
                    <topPen lineWidth="0.5" lineStyle="Solid" lineColor="#000000"/>
                    <leftPen lineWidth="0.5" lineStyle="Solid" lineColor="#000000"/>
                    <bottomPen lineWidth="0.5" lineStyle="Solid" lineColor="#000000"/>
                    <rightPen lineWidth="0.5" lineStyle="Solid" lineColor="#000000"/>
                </box>
                <textElement verticalAlignment="Middle">
                    <font fontName="Calibri" size="12"/>
                </textElement>
                <textFieldExpression><![CDATA[new SimpleDateFormat("MMM").format(DateUtils.addMonths($P{Date},-1))]]></textFieldExpression>
            </textField>
            <textField>
                <reportElement mode="Opaque" x="0" y="30" width="160" height="30" backcolor="#EDF7FF" uuid="5fa38ea6-0449-4ebf-b669-4034169caa26"/>
                <box leftPadding="10">
                    <topPen lineWidth="0.5" lineStyle="Solid" lineColor="#000000"/>
                    <leftPen lineWidth="0.5" lineStyle="Solid" lineColor="#000000"/>
                    <bottomPen lineWidth="0.5" lineStyle="Solid" lineColor="#000000"/>
                    <rightPen lineWidth="0.5" lineStyle="Solid" lineColor="#000000"/>
                </box>
                <textElement verticalAlignment="Middle">
                    <font fontName="Calibri" size="12" isBold="true"/>
                </textElement>
                <textFieldExpression><![CDATA["Current Date"]]></textFieldExpression>
            </textField>
            <textField>
                <reportElement mode="Opaque" x="0" y="60" width="160" height="30" backcolor="#EDF7FF" uuid="4f56f7e3-f84b-4aa6-a83f-c3ed7151711f"/>
                <box leftPadding="10">
                    <topPen lineWidth="0.5" lineStyle="Solid" lineColor="#000000"/>
                    <leftPen lineWidth="0.5" lineStyle="Solid" lineColor="#000000"/>
                    <bottomPen lineWidth="0.5" lineStyle="Solid" lineColor="#000000"/>
                    <rightPen lineWidth="0.5" lineStyle="Solid" lineColor="#000000"/>
                </box>
                <textElement verticalAlignment="Middle">
                    <font fontName="Calibri" size="12" isBold="true"/>
                </textElement>
                <textFieldExpression><![CDATA["Current Month - 1"]]></textFieldExpression>
            </textField>
            <textField>
                <reportElement mode="Opaque" x="0" y="90" width="160" height="30" backcolor="#EDF7FF" uuid="129247b7-38f0-4d71-8429-697723aff783"/>
                <box leftPadding="10">
                    <topPen lineWidth="0.5" lineStyle="Solid" lineColor="#000000"/>
                    <leftPen lineWidth="0.5" lineStyle="Solid" lineColor="#000000"/>
                    <bottomPen lineWidth="0.5" lineStyle="Solid" lineColor="#000000"/>
                    <rightPen lineWidth="0.5" lineStyle="Solid" lineColor="#000000"/>
                </box>
                <textElement verticalAlignment="Middle">
                    <font fontName="Calibri" size="12" isBold="true"/>
                </textElement>
                <textFieldExpression><![CDATA["Current Month + 0 "]]></textFieldExpression>
            </textField>
            <textField>
                <reportElement mode="Opaque" x="160" y="90" width="390" height="30" backcolor="#EDF7FF" uuid="5f91c64b-8d22-41b9-9448-b2285471f871"/>
                <box leftPadding="10">
                    <topPen lineWidth="0.5" lineStyle="Solid" lineColor="#000000"/>
                    <leftPen lineWidth="0.5" lineStyle="Solid" lineColor="#000000"/>
                    <bottomPen lineWidth="0.5" lineStyle="Solid" lineColor="#000000"/>
                    <rightPen lineWidth="0.5" lineStyle="Solid" lineColor="#000000"/>
                </box>
                <textElement verticalAlignment="Middle">
                    <font fontName="Calibri" size="12"/>
                </textElement>
                <textFieldExpression><![CDATA[new SimpleDateFormat("MMM").format(DateUtils.addMonths($P{Date},0))]]></textFieldExpression>
            </textField>
            <textField>
                <reportElement mode="Opaque" x="0" y="120" width="160" height="30" backcolor="#EDF7FF" uuid="f55b5d8c-da33-4b37-8345-b8d60d4682c4"/>
                <box leftPadding="10">
                    <topPen lineWidth="0.5" lineStyle="Solid" lineColor="#000000"/>
                    <leftPen lineWidth="0.5" lineStyle="Solid" lineColor="#000000"/>
                    <bottomPen lineWidth="0.5" lineStyle="Solid" lineColor="#000000"/>
                    <rightPen lineWidth="0.5" lineStyle="Solid" lineColor="#000000"/>
                </box>
                <textElement verticalAlignment="Middle">
                    <font fontName="Calibri" size="12" isBold="true"/>
                </textElement>
                <textFieldExpression><![CDATA["Current Month + 1 "]]></textFieldExpression>
            </textField>
            <textField>
                <reportElement mode="Opaque" x="160" y="120" width="390" height="30" backcolor="#EDF7FF" uuid="1745467e-740c-4863-821b-cd46041cbf95"/>
                <box leftPadding="10">
                    <topPen lineWidth="0.5" lineStyle="Solid" lineColor="#000000"/>
                    <leftPen lineWidth="0.5" lineStyle="Solid" lineColor="#000000"/>
                    <bottomPen lineWidth="0.5" lineStyle="Solid" lineColor="#000000"/>
                    <rightPen lineWidth="0.5" lineStyle="Solid" lineColor="#000000"/>
                </box>
                <textElement verticalAlignment="Middle">
                    <font fontName="Calibri" size="12"/>
                </textElement>
                <textFieldExpression><![CDATA[new SimpleDateFormat("MMM").format(DateUtils.addMonths($P{Date},1))]]></textFieldExpression>
            </textField>
            <textField>
                <reportElement mode="Opaque" x="0" y="0" width="550" height="30" forecolor="#180566" backcolor="#EDE8E8" uuid="4442c4ba-1214-4042-afc8-072027105db2"/>
                <box leftPadding="10">
                    <topPen lineWidth="0.5" lineStyle="Solid" lineColor="#000000"/>
                    <leftPen lineWidth="0.5" lineStyle="Solid" lineColor="#000000"/>
                    <bottomPen lineWidth="0.5" lineStyle="Solid" lineColor="#000000"/>
                    <rightPen lineWidth="0.5" lineStyle="Solid" lineColor="#000000"/>
                </box>
                <textElement textAlignment="Center" verticalAlignment="Middle">
                    <font fontName="Calibri" size="20" isBold="true"/>
                </textElement>
                <textFieldExpression><![CDATA["Get Prvious and Next Months month Names"]]></textFieldExpression>
            </textField>
        </band>
    </title>
</jasperReport>

Replace special character with empty space or dot in a given string(user names) usign regular expressions in Jasper Reports.

$
0
0
Hi Guys,

Hope this helps !


<?xml version="1.0" encoding="UTF-8"?>
<!-- Created with Jaspersoft Studio version 6.0.1.final using JasperReports Library version 6.0.0  -->
<!-- 2015-10-30T01:53:37 -->
<jasperReport xmlns="http://jasperreports.sourceforge.net/jasperreports" xmlns:xsi="http://www.w3.org/2001/XMLSchema-instance" xsi:schemaLocation="http://jasperreports.sourceforge.net/jasperreports http://jasperreports.sourceforge.net/xsd/jasperreport.xsd" name="Blank_A4_11" pageWidth="595" pageHeight="842" whenNoDataType="AllSectionsNoDetail" columnWidth="555" leftMargin="20" rightMargin="20" topMargin="20" bottomMargin="20" uuid="61a0c24d-0d01-45c8-9798-7b1e375005ef">
    <property name="com.jaspersoft.studio.data.defaultdataadapter" value="One Empty Record"/>
    <parameter name="Parameter1" class="java.lang.String" isForPrompting="false">
        <defaultValueExpression><![CDATA["sadakar.pochampalli@xyz.com__123"]]></defaultValueExpression>
    </parameter>
    <parameter name="Parameter2" class="java.lang.String" isForPrompting="false">
        <defaultValueExpression><![CDATA[$P{Parameter1}.toString().replaceAll("[\\W]", ".").replaceAll("_",".")]]></defaultValueExpression>
    </parameter>

    <queryString>
        <![CDATA[]]>
    </queryString>
    <background>
        <band splitType="Stretch"/>
    </background>
    <title>
        <band height="70" splitType="Stretch">
            <textField>
                <reportElement x="0" y="0" width="320" height="30" uuid="f65d6201-4a54-4f04-9540-0d7b1b061bc0"/>
                <textFieldExpression><![CDATA[$P{Parameter1}]]></textFieldExpression>
            </textField>
            <textField>
                <reportElement x="0" y="40" width="320" height="30" uuid="11d43e9d-990e-490c-95b3-faa86c13f52f"/>
                <textFieldExpression><![CDATA[$P{Parameter2}]]></textFieldExpression>
            </textField>
        </band>
    </title>
    <pageHeader>
        <band height="35" splitType="Stretch"/>
    </pageHeader>
    <columnHeader>
        <band height="61" splitType="Stretch"/>
    </columnHeader>
    <detail>
        <band height="125" splitType="Stretch"/>
    </detail>
    <columnFooter>
        <band height="45" splitType="Stretch"/>
    </columnFooter>
    <pageFooter>
        <band height="54" splitType="Stretch"/>
    </pageFooter>
    <summary>
        <band height="42" splitType="Stretch"/>
    </summary>
</jasperReport>

Tip : Tahoma bold font work around when exporting report to PDF from Jasper server 5.x or 6.x

$
0
0
Hello All,

Today, I came across an issue with Tahoma bold font issue while exporting Jasper reports into PDF.
After few hours of R&D, I have got two work around(s). I will be explaining 2 of them and hope this would be helpful if you face the same issue.

Problem Statement : 
PDF Export of bold Tahoma font before work around : 

PDF Export of bold Tahoma font after work around : 

Software used to Test this report : 
1) Jaspersoft Design Studio Professional 6.0.1  (can take 5.x or 6.x).
2) Jasperserver 6.0.1
3) Internet web browsers : IE 11.096 , firefox 41.0.2, Chrome 46.0.2490.80
4) Operating System : Windows 7

Solution 1 : 
1) Check the fonts in windows (Example : C:\Windows\Fonts)
2) Check for the Tahoma font (copy paste to some other location in the computer- to Desktop - you can see two font files copied - one is tahoma.ttf another is tahomabd.ttf )
 NOTE : If your development environment is of Linux flavour get a copy of these ttf files into it. 
3) Upload these files to a folder in Jasper server (Lets say your project folder > and a folder for fonts).

    Example :      
      
   How to ?

4) Note the path of the bold Tahoma font in the server : /Tahoma_Font_PDF__Bold_Example/Fonts/tahomabd.ttf


In a notepad file text editor write and keep the path to use in JRXML as below
pdfFontName="repo:/Tahoma_Font_PDF__Bold_Example/Fonts/tahomabd.ttf"

 4) Come back to JRXML file open the report in Source Mode and copy paste the above code for the text fields which you would like to get as bold when exporting to export. 
Before doing it, set font as bold, font type as Tahoma and etc using designer options

Example : 
<textField>
                <reportElement x="30" y="0" width="525" height="110" uuid="85182593-c9d2-419f-930d-3ee39eccaeaf"/>
                <textElement>
                    <font fontName="Tahoma" size="40" isBold="true" pdfFontName="repo:/Tahoma_Font_PDF__Bold_Example/Fonts/tahomabd.ttf"/>
                </textElement>
                <textFieldExpression><![CDATA["Tahoma Font  size 40"]]></textFieldExpression>
            </textField>
            <textField>
                <reportElement x="30" y="80" width="524" height="50" uuid="0b480149-7f23-4687-bb5d-fa944e58880e"/>
                <textElement>
                    <font fontName="Tahoma" size="30" isBold="true" pdfFontName="repo:/Tahoma_Font_PDF__Bold_Example/Fonts/tahomabd.ttf"/>
                </textElement>
                <textFieldExpression><![CDATA["Tahoma Font  size 30"]]></textFieldExpression>
            </textField>
            <textField>
                <reportElement x="30" y="170" width="228" height="30" uuid="2644d5be-3679-44dd-8369-eafed86dffd8"/>
                <textElement>
                    <font fontName="Tahoma" size="20" isBold="true" pdfFontName="repo:/Tahoma_Font_PDF__Bold_Example/Fonts/tahomabd.ttf"/>
                </textElement>
                <textFieldExpression><![CDATA["Tahoma Font  size 20"]]></textFieldExpression>
            </textField>
            <textField>
                <reportElement x="30" y="240" width="228" height="30" uuid="16f612ed-ceb1-4a6a-b397-65f64d3f8b09"/>
                <textElement>
                    <font fontName="Tahoma" size="10" isBold="true" pdfFontName="repo:/Tahoma_Font_PDF__Bold_Example/Fonts/tahomabd.ttf"/>
                </textElement>
                <textFieldExpression><![CDATA["Tahoma Font  size 10"]]></textFieldExpression>
            </textField>

 5) Save the report and publish it the server and check the output by exporting into PDF.


 Solution 2: (Hmm...!!! No more screen shots).
1) Go to Preferences in Studio (Menu bar -> Winodw -> Preferences )
2) Under Jasper Studio -> fonts -> Under Fonts -> Click on Add
3) Browse for .ttf files of Tahoma that we saved on our desktop or from windows > fonts of computer location.
4) Check the option " Embbed this font in PDF export".
5) click on Ok then find the "Export" option and click on it. It will generate a jar file with the added .ttf files.
6) Add this jar file to class path of the studio to view the output in the studio ( Your project folder name -> Build path -> Add external jar file).
7) To view the same output in the jasper server, install the generated jar file in lib folder of jasper server  
Example : C:\Jaspersoft\jasperreports-server-6.0.1\apache-tomcat\webapps\jasperserver-pro\WEB-INF\lib
8) Restart the jasper server if it is already running.
9) Publish the report to the server and check the bold font output by exporting the report into PDF.

Another way of using the JAR file 
1) In some environments like where Jasper is integrated - lets say CA PPM Clarity on ondemand systems all the time we may not have the access of installed location of Jasper or Clarity.
In such cases, we have the option of deploying the JAR file directly to the Jasper server from its UI.
#) Right click on the folder > Add jar.
#) Reference the above jar to the report in its Resources.

Otherwise , directly add the JAR file as a resource to the report. ( I have tested it with 5.6 as well 6.x in which it worked for 6.x but not for 5.6).

NOTE : The same procedure we can apply for other font families which jasper directly not supporting as of 6.x version.

I hope this helps some one .!!!
If you like it do share for community developers :-)

Questions/Comments/Suggestions are always welcome :-) :-)

Happy Reporting

Cheers.!
Sadakar Pochampalli


Tip : Adding Big Decimals in Jasper Reports

$
0
0
Hi ,

We can use below expression to add Big Decimals in Jasper Reports. 

new BigDecimal(
    ($F{unit_sales_1}==null ?new BigDecimal(0).doubleValue():$F{unit_sales_1}.doubleValue() )+
    ($F{unit_sales_2}==null ?new BigDecimal(0).doubleValue():$F{unit_sales_2}.doubleValue() )+
    ($F{unit_sales_3}==null ?new BigDecimal(0).doubleValue():$F{unit_sales_3}.doubleValue() )
)


References : 
http://docs.oracle.com/javase/7/docs/api/java/math/BigDecimal.html


Thanks,
Sadakar 

Tip : Excel export font size is decreased by 1 in Jasper Reports

$
0
0
Hi ,
This post is about the issue while exporting the reports to Excel in Jasper Reports.

Problem Statement : 
Set font size of text field 10 and export it to excel from Jasper server. You will find size for text field as 9 instead of actual size.

Report Level settings :
In Report properties add this property
net.sf.jasperreports.export.xls.font.size.fix.enabled= false 

By default above property is true

Server Level settings : 
 # To set the fontSizeFixEnabled property to false.
 # It is available in xlsExportParameters bean that can be found in WEB-INF/applicationContext.xml file.
 # By default this property is set to true, causing the observed font decrease. 
# After restarting the server, fonts should appear with their actual size.


Reference :
http://community.jaspersoft.com/wiki/xls-exporter-decreases-size-arial-font-1-11-10how-fix

TIP : Show percentages on HTML-5(and conditional coloring) and JFree Pie Chart slices in TIBCO Jasper Reports (6.x)

$
0
0
Hi,

This post will give you the tips on displaying percentage values instead of usual category labels on HTML-5 pie chart and JFree chart.
There are many ways to get the percentage but this post is related with an use case.
Category and measure would be same field i.e,  count of same value/total count of field values.


Software Used for the sample in this post 
1) Jasper Design Studio Professional 6.0.1 (6.x)
2) PostgreSQL , a "test" database and a "DUMMY" table with the below shown data.


Use Case : 
% calculation on a single field count in below query.(Taking category and measure field as same).

Analysis : (23 is the total count of the field)
number of 1's -1 ---> 1/23
number of 2's- 2 ----> 2/23
number of 0's-10 ----> 10/23
number of 5's -2 ------> 2/23
number of 4's-2  -------> 2/23
number of 8's-2    ------>2/23
number of 10's -4   ------> 4/23

SELECT * FROM DUMMY
field1 field2
a    1
b    2
c    2
m    0
n    0
o    0
p    0
q    0
r    0
s    0
t    0
u    0
v    0
m1  5
n1  5
o1  4
p1 4
q1 8
r1 8
s1 10
t1 10
u1 10
v1 10

How to ? 
On HTML-5 Pie Chart.
On Title band 
1) Drag and drop HTML 5 pie chart to Title band and right click on the chart
      and be on "Chart properties" tab
2) Click on "Show Advanced Properties" tab at bottom right corner.
3) Click on "Add" button and give below property
   Property Name = plotOptions.pie.dataLabels.format
   Check "Use an expression" check box.
  Property Value= " {point.percentage:.0f} % "
4)  Click on Ok button and come back to main tabs of chart properties. i.e, click on "Chart Data"
   Click on Configuration tab 
   Under "Category Level" click on "Level1" and give below for this use case. 
 Expression : $F{field2}
 Value Class Name : java.lang.String 
 Order : Ascending 

 For conditional colors of slices - > Click on Bucket Properties and give below
 Click on Add
 Property Name : color
 Property Expression : 
$F{field2}.toString().equals("0") ? "#DEB887" : $F{field2}.toString().equals("1")? "#5F9EA0" : $F{field2}.toString().equals("2")? "#FF7F50" : $F{field2}.toString().equals("4")? "#006400" :
$F{field2}.toString().equals("5")? "#483D8B" : $F{field2}.toString().equals("8")? "#FF00FF" : "#ADFF2F"


5) Now come to "Value section" 
Vale Definition Tab : 
Label Expression : "Measure label expression"
Calculation : Count
Value Expression : $F{field2}
Value Class Name : java.lang.Integer
Advanced  Properties 
Click on Add 
Contributor : SeriesItemProperty
Property Name : color
Use Bucket property value : Level1.color 

JFree Chart : 
To implement the JFree Bar chart for this particular data set and use case it is not as simple as we did for HTML-5. 
We need to do below work around.
1) Create a group with $F{field2}
2) Create two variables (one is to find the total count of field2 and another is to find the count of same field when the group changes).
i.e., 
Variable_1
Name = Variable_1
Value Class Name = java.lang.Integer 
Calculation = Count
Expression = $F{field2}
Increment Type = None
Reset Type = Report
Variable_2
Name = Variable_2
Value Class Name = java.lang.Integer 
Calculation = Count
Expression = $F{field2}
Increment Type = None
Reset Type =[Group] Group1  (note that Group1 is the name of the group created)

3) Drag and drop JFree pie chart to "Title band"  and right click on it and click on "Edit chart properties". 
 Give below properties on the windows.
Value = $V{Variable_2}
Key =$F{field2}.toString()
Click on "Finish" button and go the properties window of this chart .
Among 6 properties tabs for this chart,  click on "Chart Plot" tab and go the "Labels" section. 
Give Label Format = ({0} ) {2} 

NOTE: 
# Make sure created group by band height =0 to avoid empty spaces in the report.  
#  This report is not tested in Jaspeer server view but it should work.


That's all. you are done.! 

Save the report and preview. 


JRXML Code : 
 
<?xml version="1.0" encoding="UTF-8"?>
<!-- Created with Jaspersoft Studio version 6.0.1.final using JasperReports Library version 6.0.0  -->
<!-- 2015-11-06T01:00:22 -->
<jasperReport xmlns="http://jasperreports.sourceforge.net/jasperreports" xmlns:xsi="http://www.w3.org/2001/XMLSchema-instance" xsi:schemaLocation="http://jasperreports.sourceforge.net/jasperreports http://jasperreports.sourceforge.net/xsd/jasperreport.xsd" name="Graph" pageWidth="1000" pageHeight="842" columnWidth="960" leftMargin="20" rightMargin="20" topMargin="20" bottomMargin="20" uuid="77404ba2-af1b-4f3a-be4c-93002d1edd4d">
    <property name="com.jaspersoft.studio.data.defaultdataadapter" value="test_postgres"/>
    <property name="com.jaspersoft.studio.unit." value="pixel"/>
    <property name="com.jaspersoft.studio.unit.pageHeight" value="pixel"/>
    <property name="com.jaspersoft.studio.unit.pageWidth" value="pixel"/>
    <property name="com.jaspersoft.studio.unit.topMargin" value="pixel"/>
    <property name="com.jaspersoft.studio.unit.bottomMargin" value="pixel"/>
    <property name="com.jaspersoft.studio.unit.leftMargin" value="pixel"/>
    <property name="com.jaspersoft.studio.unit.rightMargin" value="pixel"/>
    <property name="com.jaspersoft.studio.unit.columnWidth" value="pixel"/>
    <property name="com.jaspersoft.studio.unit.columnSpacing" value="pixel"/>
    <queryString language="SQL">
        <![CDATA[select * from dummy]]>
    </queryString>
    <field name="filed1" class="java.lang.String"/>
    <field name="field2" class="java.lang.Integer"/>
    <variable name="Variable_1" class="java.lang.Integer" calculation="Count">
        <variableExpression><![CDATA[$F{field2}]]></variableExpression>
    </variable>
    <variable name="Variable_2" class="java.lang.Integer" resetType="Group" resetGroup="Group1" calculation="Count">
        <variableExpression><![CDATA[$F{field2}]]></variableExpression>
    </variable>
    <group name="Group1">
        <groupExpression><![CDATA[$F{field2}]]></groupExpression>
        <groupHeader>
            <band height="18"/>
        </groupHeader>
    </group>
    <title>
        <band height="369">
            <pieChart>
                <chart isShowLegend="false" evaluationTime="Report">
                    <reportElement x="540" y="0" width="420" height="369" uuid="fc0b804b-6c86-4cc8-845b-da2b015145f1"/>
                    <chartTitle/>
                    <chartSubtitle/>
                    <chartLegend/>
                </chart>
                <pieDataset>
                    <keyExpression><![CDATA[$F{field2}.toString()]]></keyExpression>
                    <valueExpression><![CDATA[$V{Variable_2}]]></valueExpression>
                </pieDataset>
                <piePlot labelFormat="({0} ) {2}" legendLabelFormat="{1}">
                    <plot/>
                    <itemLabel/>
                </piePlot>
            </pieChart>
            <componentElement>
                <reportElement x="0" y="0" width="467" height="369" uuid="bb305ca9-82de-4b15-91c1-4e285adf5640"/>
                <hc:chart xmlns:hc="http://jaspersoft.com/highcharts" xsi:schemaLocation="http://jaspersoft.com/highcharts http://jaspersoft.com/schema/highcharts.xsd" type="Pie" evaluationTime="Report">
                    <hc:chartSetting name="default">
                        <hc:chartProperty name="chart.zoomType">
                            <hc:propertyExpression><![CDATA["xy"]]></hc:propertyExpression>
                        </hc:chartProperty>
                        <hc:chartProperty name="credits.enabled">
                            <hc:propertyExpression><![CDATA[false]]></hc:propertyExpression>
                        </hc:chartProperty>
                        <hc:chartProperty name="credits.href">
                            <hc:propertyExpression><![CDATA[""]]></hc:propertyExpression>
                        </hc:chartProperty>
                        <hc:chartProperty name="credits.text">
                            <hc:propertyExpression><![CDATA[""]]></hc:propertyExpression>
                        </hc:chartProperty>
                        <hc:chartProperty name="legend.enabled">
                            <hc:propertyExpression><![CDATA[Boolean.FALSE]]></hc:propertyExpression>
                        </hc:chartProperty>
                        <hc:chartProperty name="plotOptions.pie.dataLabels.format">
                            <hc:propertyExpression><![CDATA[" {point.percentage:.0f} % "]]></hc:propertyExpression>
                        </hc:chartProperty>
                        <hc:chartProperty name="plotOptions.pie.showInLegend" value="false"/>
                        <hc:chartProperty name="title.text">
                            <hc:propertyExpression><![CDATA[""]]></hc:propertyExpression>
                        </hc:chartProperty>
                        <hc:chartProperty name="yAxis.title.text">
                            <hc:propertyExpression><![CDATA[""]]></hc:propertyExpression>
                        </hc:chartProperty>
                    </hc:chartSetting>
                    <multiAxisData>
                        <multiAxisDataset/>
                        <dataAxis axis="Rows">
                            <axisLevel name="Level1">
                                <labelExpression><![CDATA["Level Label expression"]]></labelExpression>
                                <axisLevelBucket class="java.lang.String">
                                    <bucketExpression><![CDATA[$F{field2}]]></bucketExpression>
                                    <bucketProperty name="color"><![CDATA[$F{field2}.toString().equals("0") ? "#DEB887" : $F{field2}.toString().equals("1")? "#5F9EA0" : $F{field2}.toString().equals("2")? "#FF7F50" : $F{field2}.toString().equals("4")? "#006400" :
$F{field2}.toString().equals("5")? "#483D8B" : $F{field2}.toString().equals("8")? "#FF00FF" : "#ADFF2F"


]]></bucketProperty>
                                </axisLevelBucket>
                            </axisLevel>
                        </dataAxis>
                        <multiAxisMeasure name="Measure1" class="java.lang.Integer" calculation="Count">
                            <labelExpression><![CDATA["Measure label expression"]]></labelExpression>
                            <valueExpression><![CDATA[$F{field2}]]></valueExpression>
                        </multiAxisMeasure>
                    </multiAxisData>
                    <hc:series name="Measure1">
                        <hc:contributor name="SeriesItemProperty">
                            <hc:contributorProperty name="color" valueType="Bucket" value="Level1.color"/>
                        </hc:contributor>
                    </hc:series>
                </hc:chart>
            </componentElement>
        </band>
    </title>
    <summary>
        <band height="33">
            <property name="local_mesure_unitheight" value="pixel"/>
            <property name="com.jaspersoft.studio.unit.height" value="px"/>
        </band>
    </summary>
</jasperReport>


References :  
http://community.jaspersoft.com/wiki/html5-bar-chart-how-add-percent-sign-datalabel-and-change-its-font-size

http://community.jaspersoft.com/wiki/html5-pie-chart-percentage-display

http://community.jaspersoft.com/wiki/displaying-percentage-pie-chart-labels

http://davidhoppmann.com/2013/11/26/customizing-tooltips-in-jasperreports-html5-chart-components/

http://api.highcharts.com/highcharts#plotOptions.pie.dataLabels.format

Colors : http://www.w3schools.com/html/html_colornames.asp


Tip : Paranthesis Pattern for Negative BigDecimal Type fields in Jasper Reports (6.x)

$
0
0
Hi,
This tip is useful when exporting the report to excel with negative values.

1) Select the text field that is dragged to the designer.
   (Note that the type of this field is java.math.BigDecimal)

2) Click on it and go to the properties and apply below pattern.
    #,##0.00;(#,##0.00)

3) In above pattern the first piece is applied when the BigDecimal is non-negative and second is applied when the BigDecimal is negative. 

4) This type of pattern is useful when exporting the report to Excel. 
     i.e., Differentiate negative values surrounded by parenthesis.

NOTE : In excel export if you want to get the red color then give the pattern like below.
[Red]#,##0.00;[Red](#,##0.00)

The above pattern will display Red on the Jasper report viewer but when export the report it will give you red colored decimal with the pattern applied. 
  

http://community.jaspersoft.com/questions/525396/pattern-negative-amounts-conditional-style

Tip : Half colored text in Static Text field (OR) Text field in Jasper Reports (Or) Basic usage of Markup property in Jasper Design Studio 6.x

$
0
0
Hi Folks,

Some times, small things in any technology becomes harder to find and consumes time to check whether it is possible or not or how to implement it.

Today, I have come across a small requirement that is to print half colored text taken in a "Static Text Field" or "Text Filed" in Jasper reports.

Thanks to the folks who looked into it very quickly & solved it out.

I would like to share it the community on how to do this with above two elements on behalf of my folks findings. Hope you may find it useful.

Problem Statement & Solution can be understood from below image. 


Software used to Test this example : 
1) Jasper Design Studio 6.1 professional / you can use CE Studio also.
2) Empty Data source.
3) Jasper Server is not taken to test it.

Steps :
1) Create a JRXML report as usual with no need of any data source and in the report properties select when  no data type= All sections, No detail.

2)
# Drag and drop "Static Text" element from Palette to "Title" band and adjust height and width.
# Give below expression in it.
# Select the "Static Text" and go to its properties and Markup = html

<span style="color: red;">This is red colored text</span> <br>
<span style="color:green;">This is green colored Text</span>  <br>
<span> These texts are in single Static Text Field and there in single lines</span>


NOTE : As Markup=html the <br> will work to print the text in new line. 


3) Now,
#  Drag and drop "Text" element from Palette to "Title" below to above(step-2) element.
# Give below expression in it.
# Select "Text" element and go to its properties and give "Markup=styled"

"<style forecolor='#F71C19'> Hi,I am red in color..!</style>"+"\n"+
"<style forecolor='#15D636'> Hi,I am green in color..!</style>" + "\n"+
"<style forecolor='#000000'>Hello,we both are in single Text Filed and in separate lines..!</style>"


NOTE : As the lines of code is enclosed in double quotes the sentences inside them work as "JAVA" language strings and in Java we use "\n" to separate the lines. 

NOTE : Read is used to high light the code section in the article. 

4) Save the report and preview

5) Sample output will look like as shown in image in the beginning.

References : 
1) http://jasperreports.sourceforge.net/sample.reference/markup/

2) Crystal to Jasper conversion.
( In crystal it is very easy, one can select the amount of text placed in element with mouse cursor and apply the color)   


JRXML code
 <?xml version="1.0" encoding="UTF-8"?>
<!-- Created with Jaspersoft Studio version 6.0.1.final using JasperReports Library version 6.0.0  -->
<!-- 2015-12-02T01:06:10 -->
<jasperReport xmlns="http://jasperreports.sourceforge.net/jasperreports" xmlns:xsi="http://www.w3.org/2001/XMLSchema-instance" xsi:schemaLocation="http://jasperreports.sourceforge.net/jasperreports http://jasperreports.sourceforge.net/xsd/jasperreport.xsd" name="Upload from server UI" pageWidth="595" pageHeight="842" whenNoDataType="AllSectionsNoDetail" columnWidth="555" leftMargin="20" rightMargin="20" topMargin="20" bottomMargin="20" uuid="da3cf4d1-d5ae-4e7d-acf6-5a6900abf344">
    <property name="ireport.jasperserver.url" value="http://172.16.0.28:8081/ppmreports/"/>
    <property name="ireport.jasperserver.user" value="superuser"/>
    <property name="ireport.jasperserver.report.resource" value="/organizations/training/Examples/PublishfromStudio2_files/main_jrxml"/>
    <property name="ireport.jasperserver.reportUnit" value="/organizations/training/Examples/PublishfromStudio2"/>
    <property name="com.jaspersoft.studio.data.defaultdataadapter" value="One Empty Record"/>
    <queryString language="SQL">
        <![CDATA[]]>
    </queryString>
    <title>
        <band height="285" splitType="Stretch">
            <staticText>
                <reportElement x="0" y="0" width="555" height="140" uuid="d8016ec9-0d13-4c4f-8f2f-6ee73349d052"/>
                <box>
                    <topPen lineWidth="0.5" lineStyle="Solid" lineColor="#000000"/>
                    <leftPen lineWidth="0.5" lineStyle="Solid" lineColor="#000000"/>
                    <bottomPen lineWidth="0.5" lineStyle="Solid" lineColor="#000000"/>
                    <rightPen lineWidth="0.5" lineStyle="Solid" lineColor="#000000"/>
                </box>
                <textElement textAlignment="Center" verticalAlignment="Middle" markup="html">
                    <font size="16" isBold="true"/>
                </textElement>
                <text><![CDATA[<span style="color: red;">This is red colored text</span> <br>
<span style="color:green;">This is green colored Text</span>  <br>
<span> These texts are in single Static Text Field and there in single lines</span>]]></text>
            </staticText>
            <textField>
                <reportElement x="0" y="145" width="555" height="134" uuid="26119933-1eb9-49bb-923b-190f735f9a59"/>
                <box>
                    <topPen lineWidth="0.5" lineStyle="Solid" lineColor="#000000"/>
                    <leftPen lineWidth="0.5" lineStyle="Solid" lineColor="#000000"/>
                    <bottomPen lineWidth="0.5" lineStyle="Solid" lineColor="#000000"/>
                    <rightPen lineWidth="0.5" lineStyle="Solid" lineColor="#000000"/>
                </box>
                <textElement textAlignment="Center" verticalAlignment="Middle" markup="styled">
                    <font size="16" isBold="true"/>
                </textElement>
                <textFieldExpression><![CDATA["<style forecolor='#F71C19'> Hi,I am red in color..!</style>"+"\n"+
"<style forecolor='#15D636'> Hi,I am green in color..!</style>" + "\n"+
"<style forecolor='#000000'>Hello,we both are in single Text Field and in separate lines..!</style>"]]></textFieldExpression>
            </textField>
        </band>
    </title>
    <columnHeader>
        <band height="45" splitType="Stretch"/>
    </columnHeader>
    <detail>
        <band height="163" splitType="Stretch"/>
    </detail>
</jasperReport>


 Did you find it useful ? Please click on share to help the community. 

Cheers.!
Thank you for landing on this page.  


Tip : Displaying work around "All" on report when passing nothing from multi select non mandatory parameter in Jasper Reports 6.x

$
0
0
Hi Folks,
Here is a latest work around for displaying "All" when passing nothing from "Multi select parameter" in Jasper reports.

Concept :
Display the selected values of multi select parameter on the report.
Lets say if you select "USA","Mexico" from the multi select drop down, your report should display USA,Mexico
and if you select nothing in the drop down it should display All on the report instead of all the countries.


Solution :
Find the empty collection length, if the lenght is <=2 display "All" and if the lengh is > 2 display the selected values.
•    Create a Parameter as collection (coming from clarity)
            param_country (java.util.Collection)
•    Create another parameter which will calculate the length of multi select param
            param_country_length (java.lang.String)
        * Under default value expression, write below expression
                     $P{param_country}.toString().length()
•    Your Query for report should be as follows.

SELECT
        nvl(to_char(WM_CONCAT(replace(replace(Country_Field, '['), ']'))), 'All') cf
FROM customers
WHERE
    (
            ($P{param_country_length}) > 2 and $X{IN,lookup_code,param_inv_type}
            OR
            ($P{param_country_length}) < = 2
    )


* NOTE :

# "All" should not be a value from the dropdown.
# All should be handled from SQL code.
# Query used is Oracle SQL 11g (+) specific. Functions used in SQL code may not work in lesser versions.
# Tested the report using Jasper Design Studio 6.x Professional.
# On report to display the countries use filed instead of parameter name.
   i.e., $F{Country_Field} instead of $P{param_country}
# Do all this in a sub report and call it in main report because you can not handle it in main report.
# This may not work when you select "All" option available in the multi select drop down. ( Not tested).
# This is one of the ways, we have implemented in a report. I believe there could be other ways to solve the same.

Thanks,
Sadakar Pochampalli
Open Source BI specialist. 


Viewing all 261 articles
Browse latest View live


<script src="https://jsc.adskeeper.com/r/s/rssing.com.1596347.js" async> </script>