Hi,
In this post, you would lean how to implement "ArcGuage" HTML-5 chart in jasper reports.
1. Drag and Drop "ArcGauge" from HTML-5 charts.
2. Configure query value or modify existing value for "Measure".
3. Apply advanced properties for the chart.
Example Developed on :
7.8 TIBCO Jaspersoft Studio Professional and expect to work on same on higher versions.
7.8 Enterprise JasperReports Server
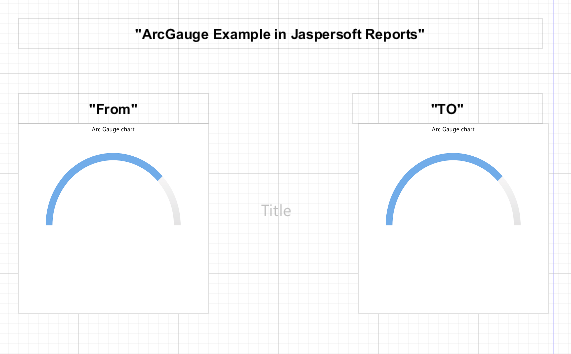
Design:
Output: 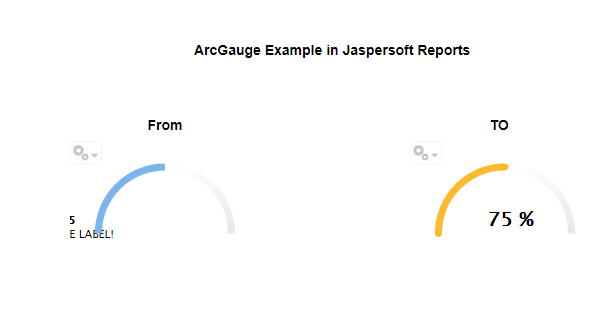
Key implementations: (or Advanced Properties Applied on ArcGuage chart)
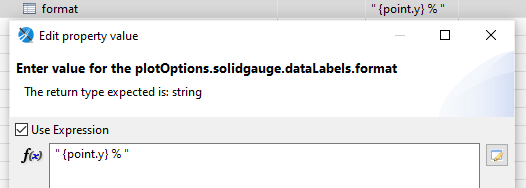
1. Format -->75%
plotOptions.solidgauge.dataLabels.format = "{point.y}%" (Use Expression)
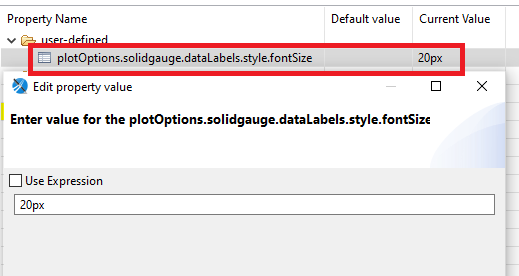
2. fontSize --> 20px
plotOptions.solidgauge.dataLabels.fontSize=20px (with out expression checked)
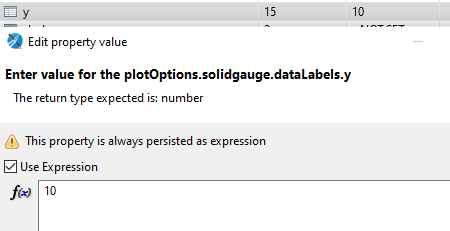
plotOptions.solidgauge.dataLabels.y=10 (with expression checked)
JRXML:
<?xml version="1.0" encoding="UTF-8"?>
<!-- Created with Jaspersoft Studio version 7.8.0.final using JasperReports Library version 6.14.0-2ab0d8625be255bf609c78e1181801213e51db8f -->
<jasperReportxmlns="http://jasperreports.sourceforge.net/jasperreports"xmlns:xsi="http://www.w3.org/2001/XMLSchema-instance"xsi:schemaLocation="http://jasperreports.sourceforge.net/jasperreports http://jasperreports.sourceforge.net/xsd/jasperreport.xsd"name="GuagueCharts"pageWidth="595"pageHeight="842"columnWidth="555"leftMargin="20"rightMargin="20"topMargin="20"bottomMargin="20"uuid="f27937b3-0ad1-4a1e-a658-f3719eeec5fa">
<propertyname="com.jaspersoft.studio.data.sql.tables"value=""/>
<propertyname="com.jaspersoft.studio.data.defaultdataadapter"value="foodmart"/>
<propertyname="ireport.jasperserver.url"value="http://localhost:8080/jasperserver-pro/"/>
<propertyname="ireport.jasperserver.user"value="superuser"/>
<propertyname="ireport.jasperserver.report.resource"value="/EarthlySystemsReports/GuagueCharts_files/main_jrxml"/>
<propertyname="ireport.jasperserver.reportUnit"value="/EarthlySystemsReports/GuagueCharts"/>
<queryStringlanguage="SQL">
<![CDATA[select 1 as One]]>
</queryString>
<fieldname="one"class="java.lang.Integer">
<propertyname="com.jaspersoft.studio.field.name"value="one"/>
<propertyname="com.jaspersoft.studio.field.label"value="one"/>
</field>
<title>
<bandheight="433"splitType="Stretch">
<componentElement>
<reportElementx="360"y="130"width="190"height="190"uuid="903e1a78-2f90-4af9-a8fa-5d005b912bc6"/>
<hc:chartxmlns:hc="http://jaspersoft.com/highcharts"xsi:schemaLocation="http://jaspersoft.com/highcharts http://jaspersoft.com/schema/highcharts.xsd"type="ArcGauge"evaluationTime="Report">
<hc:chartSettingname="default">
<hc:chartPropertyname="title.text"value=""/>
<hc:chartPropertyname="credits.enabled"value="false"/>
<hc:chartPropertyname="credits.href"value=""/>
<hc:chartPropertyname="credits.text"value=""/>
<hc:chartPropertyname="yAxis.title.text"value=""/>
<hc:chartPropertyname="chart.zoomType"value="xy"/>
<hc:chartPropertyname="yAxis.labels.y">
<hc:propertyExpression><![CDATA[-45]]></hc:propertyExpression>
</hc:chartProperty>
<hc:chartPropertyname="colors_customSimpleMode"value="true"/>
<hc:chartPropertyname="colors">
<hc:propertyExpression><![CDATA[Arrays.asList("#FFBA2C","#434348","#90ed7d","#f7a35c","#8085e9","#f15c80","#e4d354","#2b908f","#f45b5b","#91e8e1")]]></hc:propertyExpression>
</hc:chartProperty>
<hc:chartPropertyname="chart.borderRadius_measureUnit"value="{"key":"px","name":"px"}"/>
<hc:chartPropertyname="chart.borderRadius_customSimpleMode"value="true"/>
<hc:chartPropertyname="chart.borderRadius">
<hc:propertyExpression><![CDATA[0]]></hc:propertyExpression>
</hc:chartProperty>
<hc:chartPropertyname="chart.borderWidth_measureUnit"value="{"key":"px","name":"px"}"/>
<hc:chartPropertyname="chart.borderWidth_customSimpleMode"value="true"/>
<hc:chartPropertyname="chart.borderWidth">
<hc:propertyExpression><![CDATA[0]]></hc:propertyExpression>
</hc:chartProperty>
<hc:chartPropertyname="chart.plotBorderWidth_measureUnit"value="{"key":"px","name":"px"}"/>
<hc:chartPropertyname="chart.plotBorderWidth_customSimpleMode"value="true"/>
<hc:chartPropertyname="chart.plotBorderWidth">
<hc:propertyExpression><![CDATA[0]]></hc:propertyExpression>
</hc:chartProperty>
<hc:chartPropertyname="plotOptions.series.lineWidth_measureUnit"value="{"key":"px","name":"px"}"/>
<hc:chartPropertyname="plotOptions.series.lineWidth_customSimpleMode"value="true"/>
<hc:chartPropertyname="plotOptions.series.lineWidth">
<hc:propertyExpression><![CDATA[2]]></hc:propertyExpression>
</hc:chartProperty>
<hc:chartPropertyname="plotOptions.solidgauge.rounded_customSimpleMode"value="true"/>
<hc:chartPropertyname="plotOptions.solidgauge.rounded">
<hc:propertyExpression><![CDATA[true]]></hc:propertyExpression>
</hc:chartProperty>
<hc:chartPropertyname="plotOptions.solidgauge.dataLabels.style.fontSize"value="20px"/>
<hc:chartPropertyname="plotOptions.solidgauge.dataLabels.y_customSimpleMode"value="true"/>
<hc:chartPropertyname="plotOptions.solidgauge.dataLabels.y">
<hc:propertyExpression><![CDATA[10]]></hc:propertyExpression>
</hc:chartProperty>
<hc:chartPropertyname="plotOptions.solidgauge.dataLabels.format">
<hc:propertyExpression><![CDATA[" {point.y} % "]]></hc:propertyExpression>
</hc:chartProperty>
</hc:chartSetting>
<multiAxisData>
<multiAxisDataset>
<datasetresetType="Report"/>
</multiAxisDataset>
<dataAxisaxis="Rows">
<axisLevelname="Level1">
<labelExpression><![CDATA["Level Label expression"]]></labelExpression>
<axisLevelBucketclass="java.lang.Comparable">
<bucketExpression><![CDATA["Change Me"]]></bucketExpression>
</axisLevelBucket>
</axisLevel>
</dataAxis>
<dataAxisaxis="Columns"/>
<multiAxisMeasurename="Measure1"class="java.lang.Number"calculation="Nothing">
<labelExpression><![CDATA["!MEASURE LABEL!"]]></labelExpression>
<valueExpression><![CDATA[new Integer(75)]]></valueExpression>
</multiAxisMeasure>
</multiAxisData>
<hc:seriesname="Measure1"/>
</hc:chart>
</componentElement>
<componentElement>
<reportElementx="20"y="130"width="190"height="190"uuid="4e9d2f6d-3ed7-432f-b03f-692decdd6abf"/>
<hc:chartxmlns:hc="http://jaspersoft.com/highcharts"xsi:schemaLocation="http://jaspersoft.com/highcharts http://jaspersoft.com/schema/highcharts.xsd"type="ArcGauge"evaluationTime="Report">
<hc:chartSettingname="default">
<hc:chartPropertyname="title.text"value=""/>
<hc:chartPropertyname="credits.enabled"value="false"/>
<hc:chartPropertyname="credits.href"value=""/>
<hc:chartPropertyname="credits.text"value=""/>
<hc:chartPropertyname="yAxis.title.text"value=""/>
<hc:chartPropertyname="chart.zoomType"value="xy"/>
<hc:chartPropertyname="com.jaspersoft.studio.highcharts.dataconfiguration.simple"value="true"/>
</hc:chartSetting>
<multiAxisData>
<multiAxisDataset>
<datasetresetType="Report"/>
</multiAxisDataset>
<dataAxisaxis="Rows">
<axisLevelname="Level1">
<labelExpression><![CDATA["Level Label expression"]]></labelExpression>
<axisLevelBucketclass="java.lang.Comparable">
<bucketExpression><![CDATA["Change Me"]]></bucketExpression>
</axisLevelBucket>
</axisLevel>
</dataAxis>
<multiAxisMeasurename="Measure1"class="java.lang.Number"calculation="Nothing">
<labelExpression><![CDATA["!MEASURE LABEL!"]]></labelExpression>
<valueExpression><![CDATA[new Integer(75)]]></valueExpression>
</multiAxisMeasure>
</multiAxisData>
</hc:chart>
</componentElement>
<textField>
<reportElementx="20"y="25"width="524"height="30"uuid="f7ce943c-5507-4840-b765-50dda242be63"/>
<textElementtextAlignment="Center"verticalAlignment="Middle">
<fontsize="14"isBold="true"/>
</textElement>
<textFieldExpression><![CDATA["ArcGauge Example in Jaspersoft Reports"]]></textFieldExpression>
</textField>
<textField>
<reportElementx="20"y="100"width="190"height="30"uuid="0a91f891-9ee2-40c0-8922-777a80a66441"/>
<textElementtextAlignment="Center"verticalAlignment="Middle">
<fontsize="14"isBold="true"/>
</textElement>
<textFieldExpression><![CDATA["From"]]></textFieldExpression>
</textField>
<textField>
<reportElementx="354"y="100"width="190"height="30"uuid="889ebff8-e786-427d-ac3f-33ae603875b2"/>
<textElementtextAlignment="Center"verticalAlignment="Middle">
<fontsize="14"isBold="true"/>
</textElement>
<textFieldExpression><![CDATA["TO"]]></textFieldExpression>
</textField>
</band>
</title>
</jasperReport>